Data will help solve the big problems of tomorrow.
Prepare your middle and high school students today.
Looking for the college-level product? Visit DataClassroom U
Looking for the college-level product? Visit DataClassroom U


Make pro-quality graphs in seconds
Students can spend less time making graphs and more time thinking about data.

Stats don’t have to be intimidating
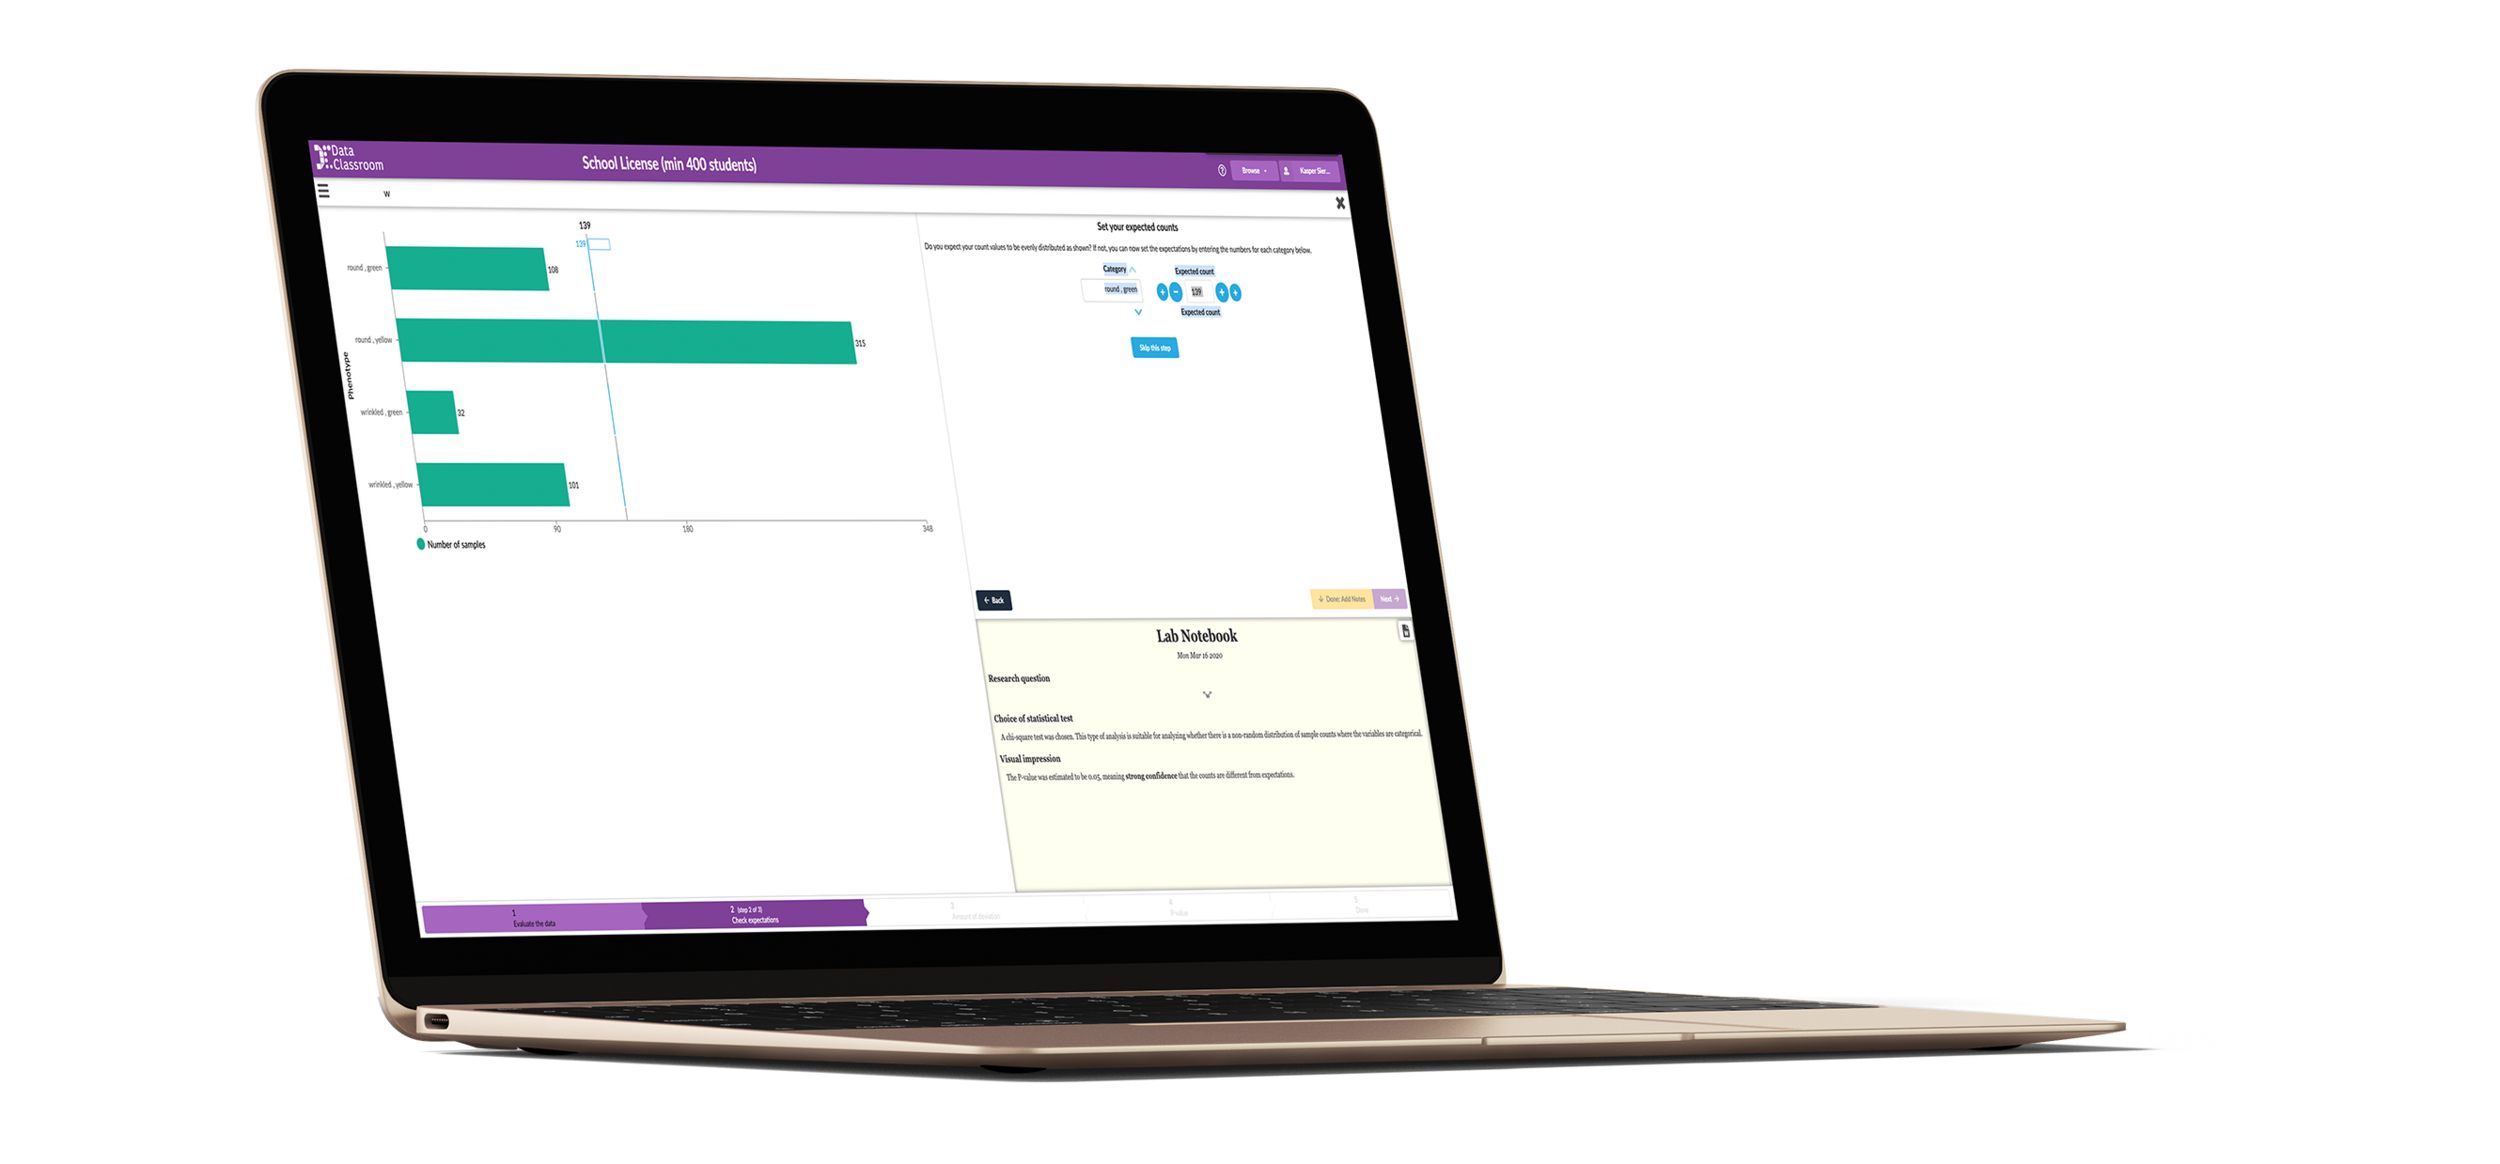
Visuals explain the math and guide students to interpret results.
The World Health Organization (WHO) began the Global Polio Eradication Initiative (GPEI) in 1988 with the goal of eradicating polio. The main tool used to eliminate polio was the oral polio vaccine. Use this dataset to explore what has happened in different locations around the world since the GPEI efforts began.
Green plants use light energy to produce their own food with photosynthesis You may have already learned that plants require water and carbon dioxide and light for photosynthesis and produce oxygen and glucose sugar in the process. If one of those three inputs (water, carbon dioxide, or light) is in short supply, then photosynthesis will slow down or even stop. How does light intensity affect the rate of photosynthesis?
Climate change affects all life on earth. Predicting how a warming climate will affect species on earth is one of the biggest goals for climate researchers today. Despite the importance of this goal, a precise answer to the question of how climate change will affect species in the future is still being sought. One of the key places that scientists look for answers is in the past. Specifically they look to geologic data to provide insight into how past temperature changes and extinction rates have been correlated so that we can make predictions about the effect that our now warming climate may have on species currently living on our planet.
Covid-19 has affected nearly all of us in some way. The arrival of widespread vaccine use brought much optimism in the US and worldwide in late 2020 and early 2021. By October of 2021 more than 65% of Americans (76% of all eligible at the time of writing) have received at least one Covid-19 vaccine shot. However, throughout the late summer and fall of 2021, Covid-19 cases, hospitalizations, and deaths spiked throughout much of the US.
Surface Anomaly Temperatures from My NASA Data. This dataset was made by taking a subset of a larger NASA dataset. It records monthly temperature anomalies for nearly the entire globe from January 1880 through March of 2021. For the dataset in this activity, we haphazardly selected three locations each as samples for low, middle, and high latitudes. This dataset can be used to examine evidence for climate change and the ice albedo effect.
When we represent chemical reactions using balanced equations, the quantities of the reactants will always be fully consumed in order to produce the quantities of the products in the equation.
It is sometimes important to know how quickly a particular chemical reaction occurs. We can discern this information by measuring either the amount of reactant(s) consumed over time or the amount of product(s) produced over time.
Also: Check out our documentation of NGSS, TEKS, NGSSS and SOL alignments here

Asking questions and defining problems

Developing and using models

Planning and carrying out investigations

Analyzing and interpreting data

Using mathematics and computational thinking

Constructing explanations and designing solutions

Engaging in argument through evidence

Obtaining, evaluating, and communicating information
“Data analysis now becomes the exciting part of the day!”
“The animations really brought the statistics alive for me.”
“DataClassroom walks students through the process step by step, giving definitions and explanations along the way.”
“Students become more secure with their data skills and their confidence increases ... it changes everything.”

DataClassroom is available with a free trial (no card required) so you can see what it can do for you and your students.
Individual, Teacher and School licenses available.
“Beautiful layout and design”
“Very good interactive learning”
“Attentive to detail and very user friendly”
“It has sparked my curiosity in statistics”
“Easy to enter data, attractive graphs”
“Stress-free to work with”
Your students did an experiment, and are keen to see what it shows.
You know it's important for students to be able to read graphs.
We want to make it fun to create graphs so that students want to read graphs.
Our analysis process lets students perform hypothesis tests, the result of which is the experimental significance
Students need to communicate their newly-discovered knowledge to the world

Our Mission
Data skills are key to solving the biggest problems of tomorrow. DataClassroom exists to help students understand both those problems and how to unlock their solutions.
As data becomes an increasingly valuable resource across all fields, the teaching of data skills is becoming increasingly important for middle and high school classrooms. At the same time, as educators, we recognize that the best part of a science education will always be hands-on labs and authentic experimentation. DataClassroom provides teachers the opportunity to integrate next generation data-skills seamlessly with the learning experiences they are already creating.
Exploring how pollution from Brunswick Superfunds impact marine animals.