Elodea Photosynthesis Lab
Use this classroom dataset from a classic lab to see how light intensity affects photosynthesis. You can also collect, upload, and analyze your own data from this classic biology and life science lab.
Warm up
What do you notice in this short video (1:38)? What do you think is causing the bubbles to form? Why do you think that?
Background
Green plants use light energy to produce their own food with photosynthesis You may have already learned that plants require water and carbon dioxide and light for photosynthesis and produce oxygen and glucose sugar in the process. If one of those three inputs (water, carbon dioxide, or light) is in short supply, then photosynthesis will slow down or even stop. How does light intensity affect the rate of photosynthesis?
By analyzing data from a classic lab experiment we can draw some conclusions about the effect of light intensity (or strength) on photosynthesis.
Dataset
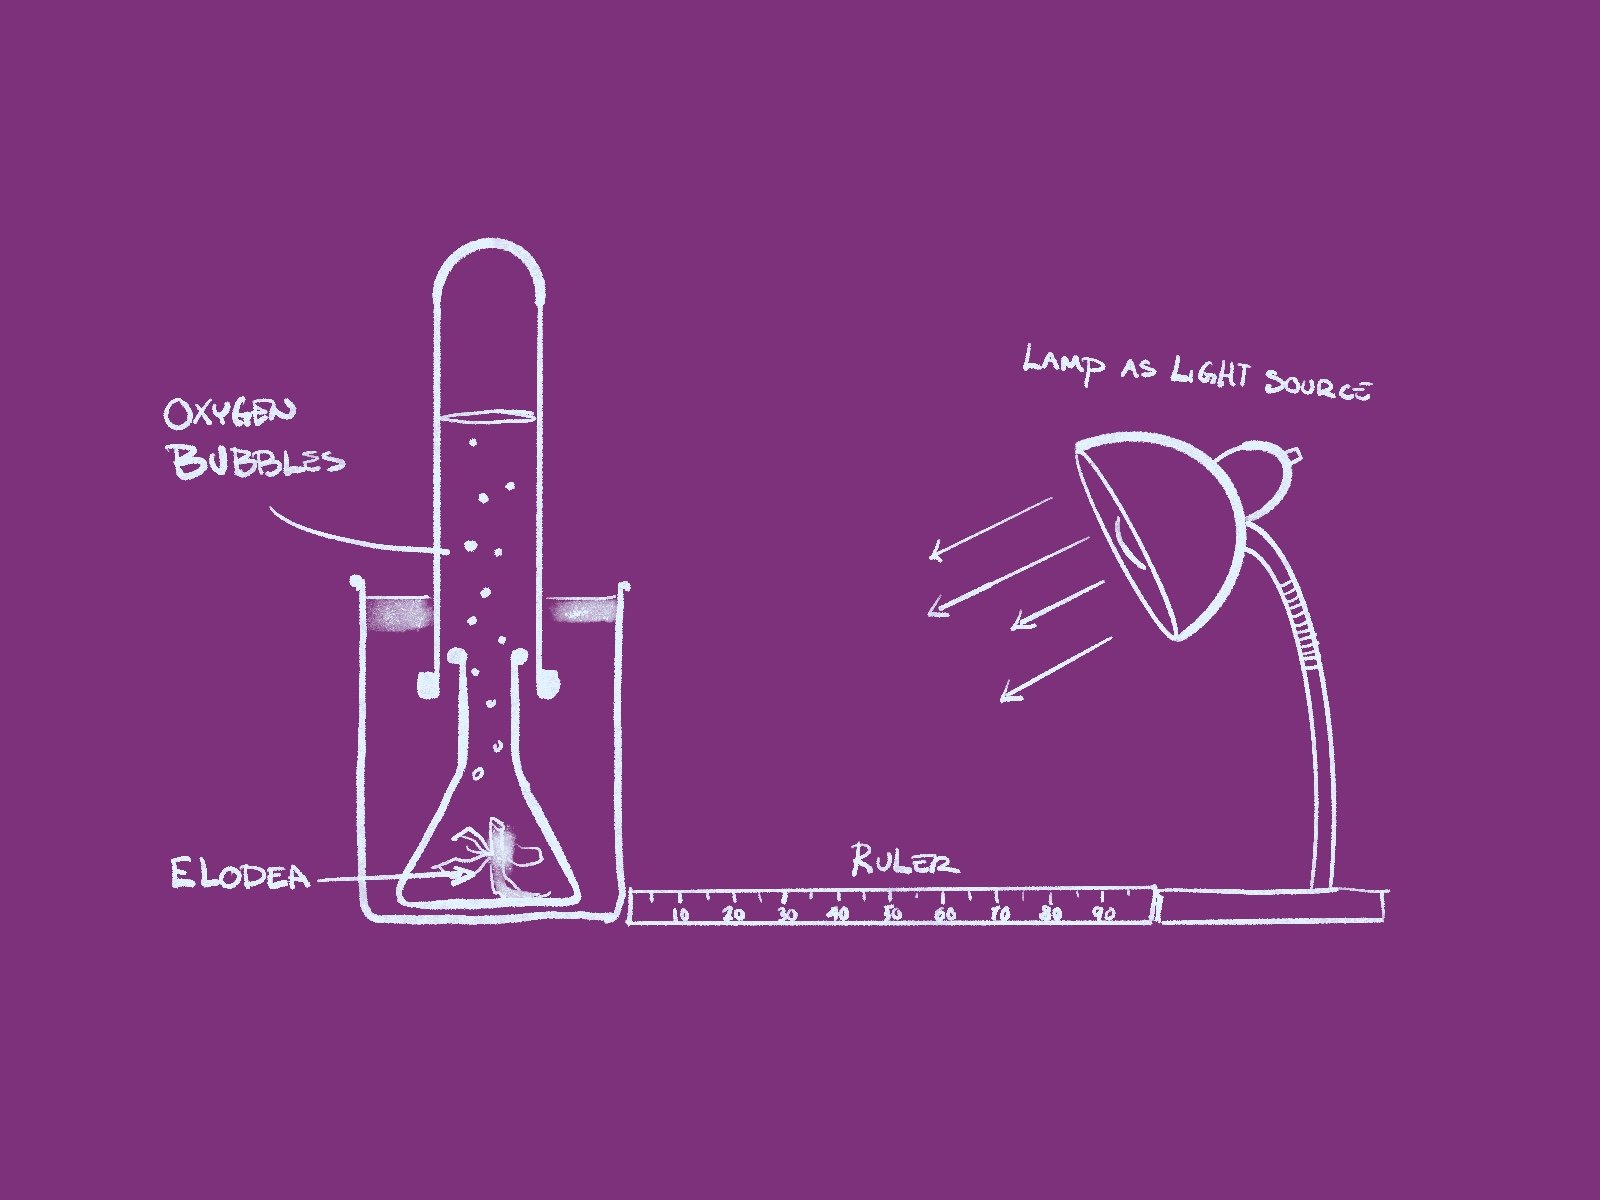
This classroom experiment used an aquatic plant called Elodea that commonly grows in lakes and ponds and is sold in pet stores for use in home aquariums. A freshly cut stem of Elodea was placed in a beaker of water. A small desk lamp was used as a light source while all other sources of light in the classroom were darkened. Students counted the number of oxygen bubbles what were produced by the plant during a two minute period.
Each of five groups of students repeated this experiment with the light source at five different distances (10cm, 20cm, 30cm, 40cm, 50cm). Their data are recorded in this class dataset. Each row in the dataset is a single observation recorded and each column represents a different variable.
Variables
Distance Treatment- This categorical variable records which of the five set distances the light source was set at for a specific observation. It is coded as a categorical variable because there are five fixed distances (10, 20, 30, 40, 50). You can change this variable type to numeric for different graphing or analyses options if you wish.
Student Lab Group- This categorical variable records which student lab group made a particular observation. There are five lab groups. Each lab group made one observation for each Distance Treatment.
Number of Oxygen Bubbles- This numeric variable is the number of bubbles observed during the two minute observation period.
Activity

You can click the edit button to the right of this document to begin editing your own copy of this document in Google Docs. You will first need to save your own copy of this dataset to do this.
1) Make a graph showing Number of Oxygen Bubbles on the Y-Axis and Distance Treatment on the X-axis. Click the Descriptive stats check box on the right to add the mean and standard deviation for each treatment to your graph. Use the camera icon to copy and paste your graph to this answer sheet.
2) How does the average value of Number of Oxygen Bubbles change as the distance of the Elodea plant from the light source increases? Look to the graph you made above for specifics to use in this answer.
3) Why does the distance from the light source change the amount of oxygen bubbles observed?
4) The number of bubbles produced in this experiment were the dependent variable that we measured (by counting) and indicate that photosynthesis is occurring. Based on what you know about photosynthesis, which products is the plant producing during the time the bubbles were observed?
5) Based on what you observed in this experiment and what you know about photosynthesis, what would you expect to happen to a plant that was kept in the dark for a long period of time (several weeks)? Why?