Reaction Rate Lab

Introduction
It is sometimes important to know how quickly a particular chemical reaction occurs. We can discern this information by measuring either the amount of reactant(s) consumed over time or the amount of product(s) produced over time. This measurement is referred to as the reaction rate.
Let’s say you’re conducting the following reaction in the lab:
aA + bB → cC + dD
In this equation, A and B are reactants, C and D are products, and a, b, c, and d are the molar coefficients of each compound. If you measure the concentration of one or more of these compounds at two different points in time, you can then calculate the reaction rate using the following equation:

What this tells us is that the reaction rate is the rate of decrease in concentration of the reactants in an equation or the rate of increase in concentration of the products in an equation.
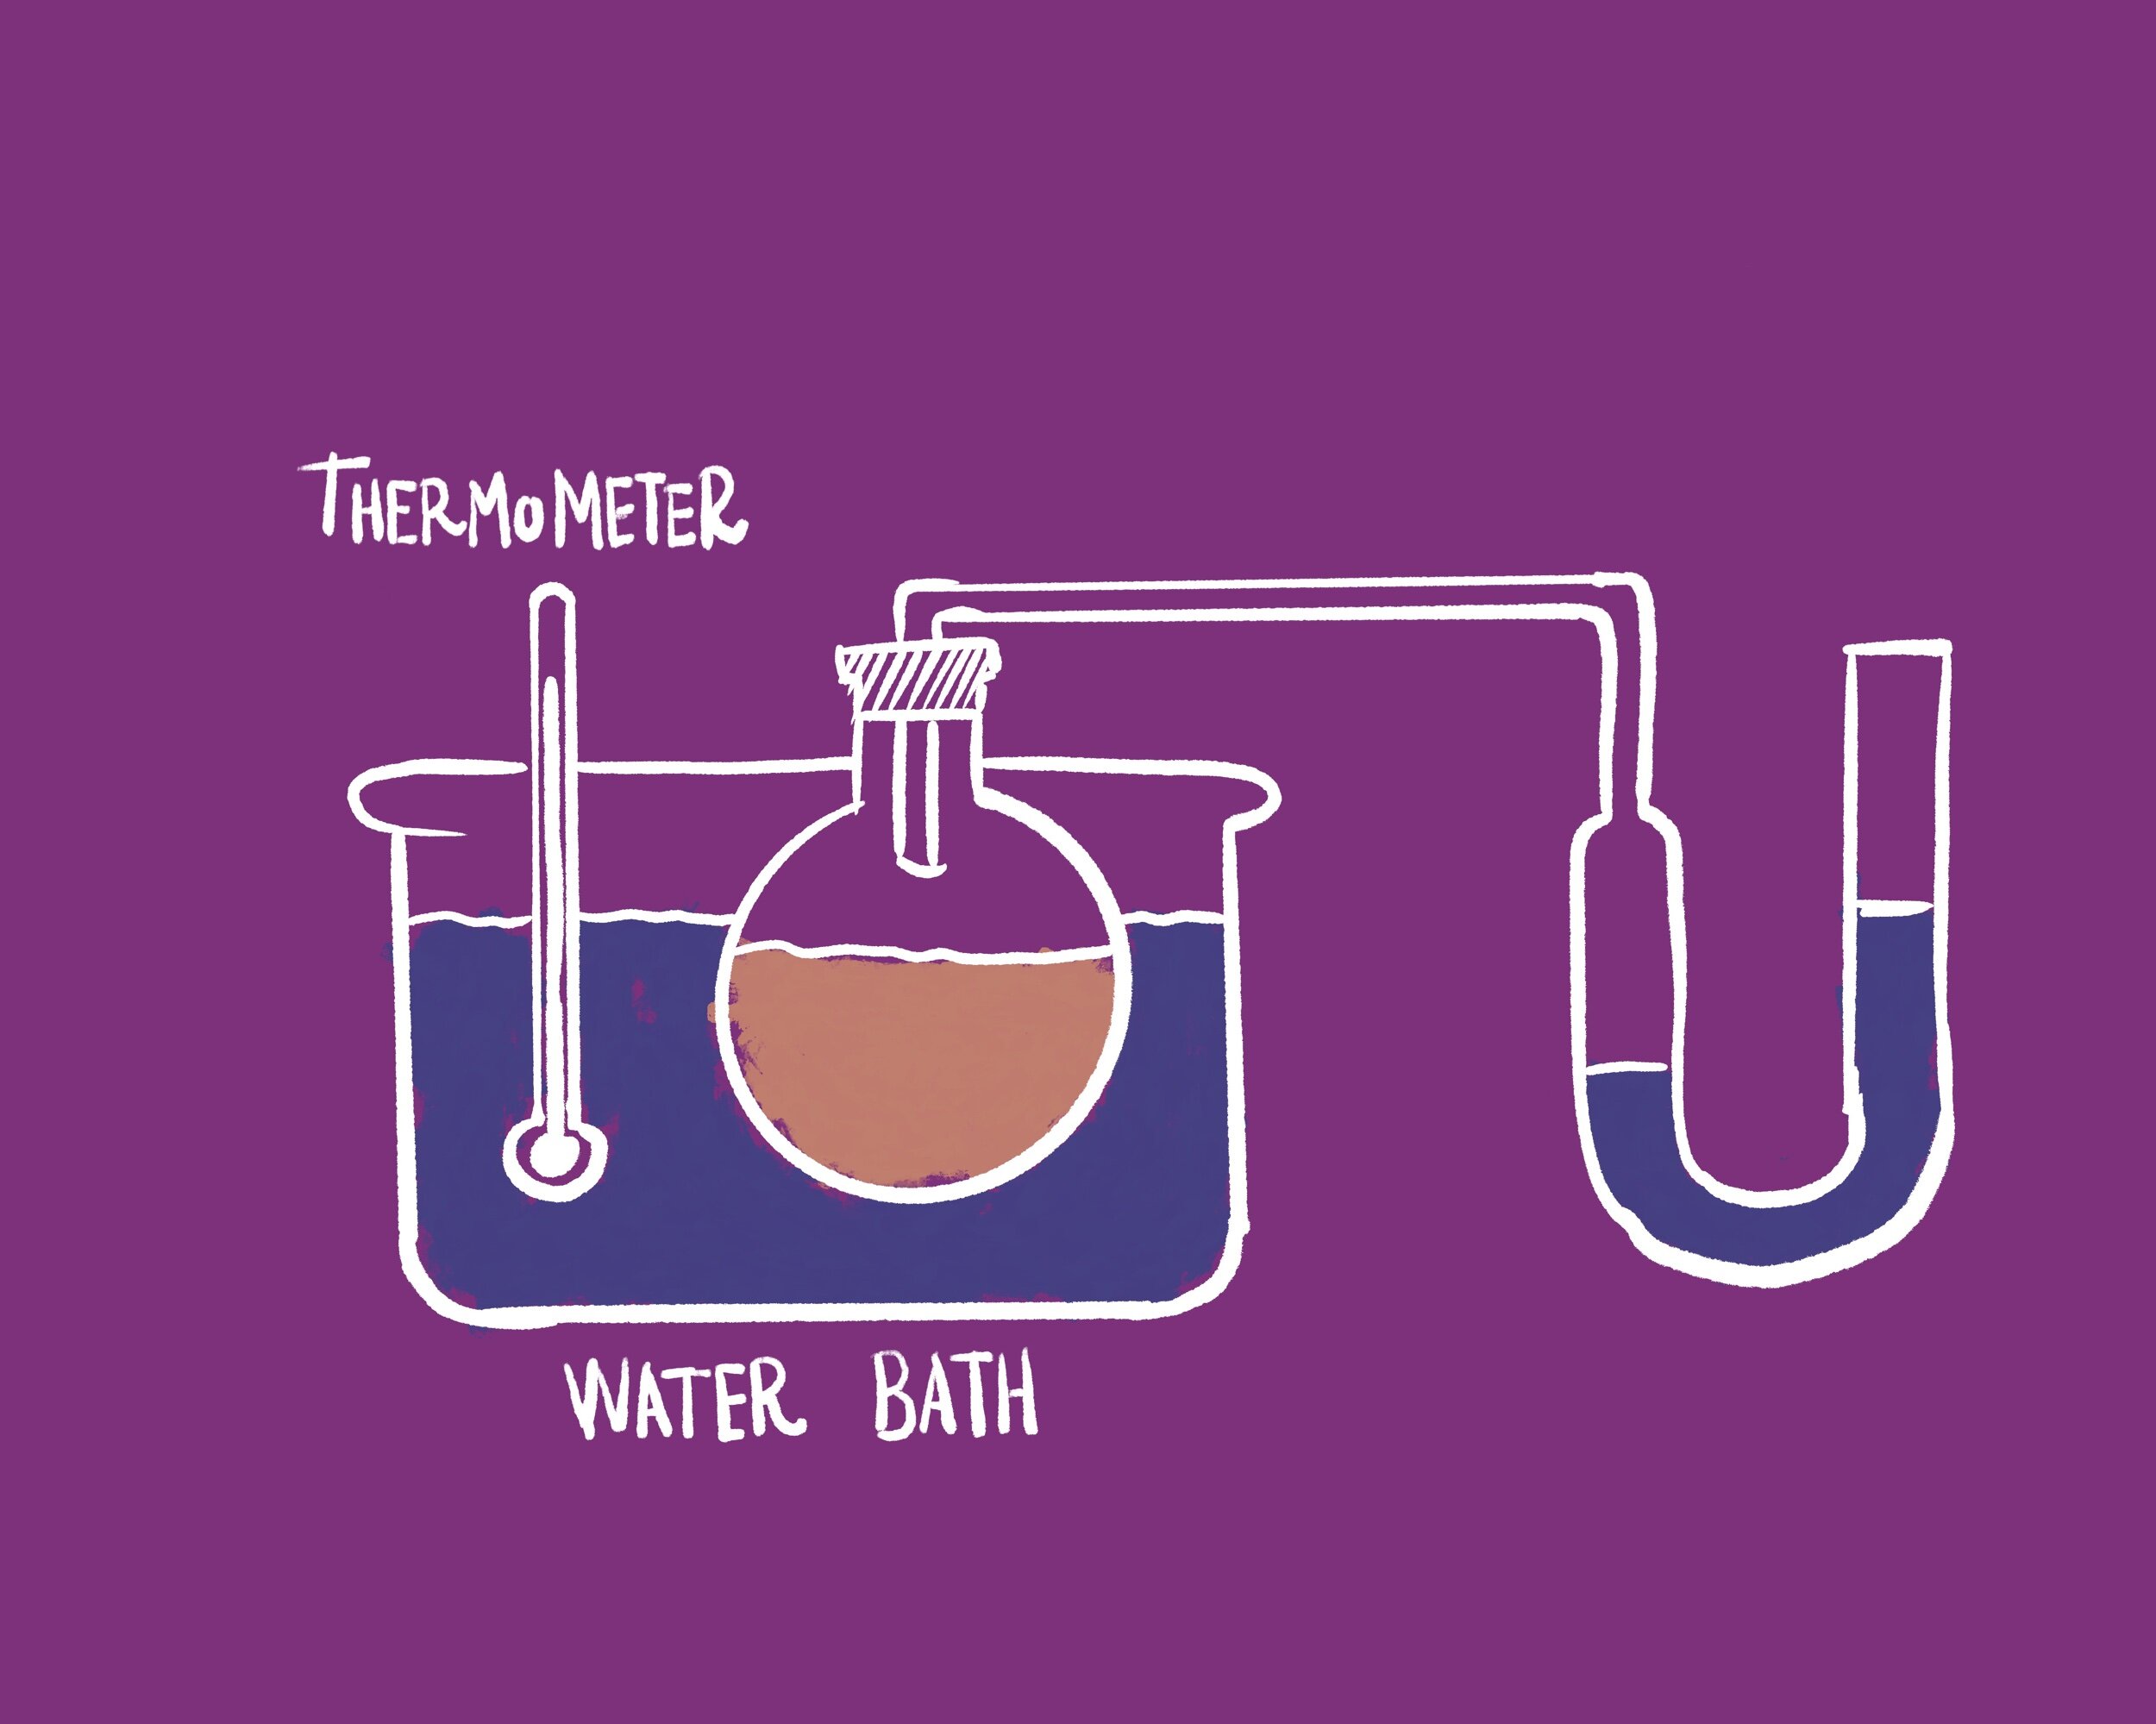
The gaseous compound dinitrogen pentoxide (N₂O₅) decomposes in air to yield nitrogen dioxide gas (NO₂) and oxygen gas (O₂). If we can determine the rate of this decomposition, we can also determine the concentration of dinitrogen pentoxide in a given sample at any point in time. This reaction is typically conducted in an apparatus such as the following, in which the water bath is used to control the temperature surrounding the dinitrogen pentoxide gas.
You’ll use the dataset in this activity to determine if the rate of decomposition of N₂O₅ varies over time.
The Dataset
In your analysis, you’ll examine data collected during the decomposition of 0.25 M dinitrogen pentoxide gas. The concentrations of dinitrogen pentoxide, nitrogen dioxide, and oxygen were measured at eight different time points at normal atmospheric pressure and a temperature of 45°C.
Note: The data in this activity are idealized. Values were calculated using the first-order integrated rate law [A]=[A]ₒe⁻ᵏᵗand the rate constant k = 6.20 x 10⁻⁴ M/s.
The Activity
1. Write a balanced equation for the decomposition of dinitrogen pentoxide. Include phase notations.
2. Make a graph showing the change in dinitrogen pentoxide and the two products over time.

Click on the Graph tab at the top of the screen to switch to graph view. Be sure that the Scatter/Box/Bar or Categorical Bubble icon is selected; this will ensure you make a scatter plot. Click the Show buttons beneath the variable names to show the independent variable on the X-axis and the dependent variable on the Y-axis of the graph. Be sure each variable is showing on the correct axis. If it’s not, you can correct that on the panel to the right side of your graph. Next, click on the Show button under the Compound variable and select the Z axis (on the right-side panel). This will show each compound’s data with its own color. Finally, check the Connect Dots box.
3. Use the graph to describe the trend in concentration over time for each compound. Is this data consistent with the equation for the reaction? How do you know?
4. Return to the Table tab. Calculate the average reaction rate for each of the following time intervals in moles of N₂O₅ consumed per liter per second. (Note: Moles per liter equates to molar, which is abbreviated M.)
| Time Interval | Rxn Rate (M/s) | |
|---|---|---|
| 300 - 400 s | ||
| 600 - 700 s | ||
| 800-900 s |
5. Express the average reaction rate for each time interval in moles of NO₂ produced per liter per second.
6. What conclusion can you draw about the rate of N₂O₅ consumed as compared to the rate of NO₂ produced in the decomposition of N₂O₅ at any given point in time over the course of this decomposition reaction? Is this relationship represented in the chemical equation for the reaction? Explain why or why not.
7. Return to the Graph tab. Using the graph and your calculations from questions 4 and 5, describe what happens to the rate of decomposition of N₂O₅ over time. How does the data support your claim?
8. Explain why this trend in the reaction rate occurs.