
Sizing up Sturgeon
Exploring fish capture data to look at body size and condition in Gulf sturgeon

Background:
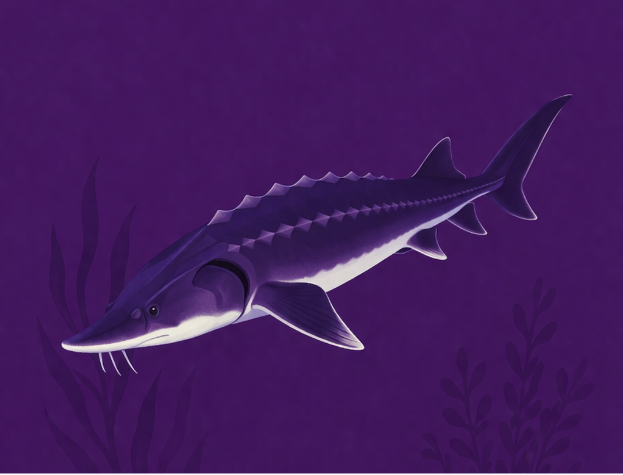
Gulf sturgeon (Acipenser oxyrinchus desotoi) are among the oldest types of fish still living on Earth today. Their ancestors swam alongside dinosaurs more than 200 million years ago, and modern Gulf sturgeon still carry the hallmarks of that ancient lineage: rows of bony armor plates called scutes, a cartilaginous skeleton, and a vacuum-like mouth designed to suck up food from riverbeds and ocean floors.
Adult sturgeon can exceed 2 meters in length and weigh more than 80 kilograms (roughly the size of an adult human!). Additionally, Gulf sturgeon grow very slowly and don't reproduce until they are at least 7 to 17 years old. This makes them especially vulnerable: if too many adults are lost before they reproduce, the population can collapse faster than it can recover.
Unfortunately, that is exactly what happened. For centuries, (before implementing no-kill methods of egg extraction) Gulf sturgeon were harvested in enormous numbers for their meat and eggs (sold as expensive caviar). By the early 1900s, populations had crashed across their entire range. Dams built across rivers cut off spawning grounds. Water quality declined. By 1991, the Gulf sturgeon was officially listed as a threatened species under the Endangered Species Act — just one step away from becoming an endangered species.
Today, Gulf sturgeon survive in just a few river systems along the northern Gulf of Mexico, from the Suwannee River in Florida west to the Pearl River in Louisiana. Each spring, adults migrate from the Gulf of Mexico into freshwater rivers to spend the warm months. Each fall, they return to the Gulf to feed. Scientists have used this predictable migration pattern to study Gulf sturgeon populations.
Gulf sturgeon live in two places during the year:
Spring to fall: in rivers. They swim up freshwater rivers in spring. During the hot summer, they rest in deep pools and eat very little.
Winter: in the Gulf of Mexico. In fall they swim out to the salty Gulf, where they feed on worms, shrimp and other small animals on the sea floor.
In 2010, the Deepwater Horizon oil spill released millions of barrels of oil into the Gulf. Scientists wanted to know how Gulf sturgeon were doing, so they caught fish in eight rivers in fall 2010 (as the fish swam out to the Gulf) and spring 2011 (as they came back). Each fish was measured, weighed, tagged and released
Dataset
Biologists from the U.S. Fish and Wildlife Service, NOAA and BP caught, measured and tagged Gulf sturgeon in eight rivers from Louisiana to Florida after the 2010 Deepwater Horizon oil spill. Fall 2010 sampling caught fish swimming out to the Gulf; spring 2011 sampling caught fish returning to the rivers. Lengths were converted to centimeters, and Condition Factor (K) was calculated as 100,000 × weight ÷ length³. Twelve fish were caught twice. This version of the dataset keeps one capture per fish (the spring capture for the 7 fish caught in both seasons, otherwise the first capture), so every row in the dataset is a different fish.
Source: BP Gulf Science Data. 2016. Data Collection to Determine Potential Exposure and Injuries of Threatened Gulf Sturgeon in Eight River Systems from Louisiana to Florida and Coastal Gulf of Mexico Waters from September 2010 to May 2011. Distributed by GRIIDC, Harte Research Institute, Texas A&M University–Corpus Christi. https://doi.org/10.7266/N78C9TNJ.
Variables
Fish ID - This is an identifier that is a unique ID for each fish (GS-001 to GS-451).
Date - This is coded as info. The day the fish was caught, from Sept. 27, 2010 to Apr. 28, 2011.
Season - This categorical variable indicates when the fish was caught. Fall 2010 fish were heading out to the Gulf; Spring 2011 fish were returning to the rivers.
River - This categorical variable indicates which of 8 Gulf Coast rivers the fish was caught in, from the Pearl (Louisiana–Mississippi border) east to the Suwannee (Florida). Bay captures are grouped with their nearest river.
Sex - This categorical variable has the values of Female, Male or Unknown. Most fish (428) are Unknown, because sturgeon are hard to sex externally.
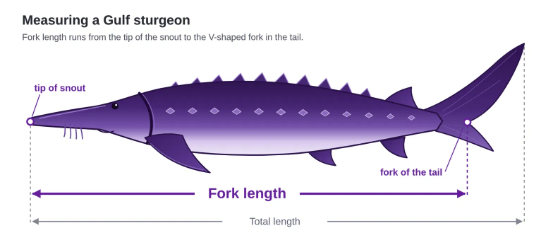
Fork Length (cm) - This numeric variable is the measured length from the tip of the snout to the fork (the V) in the tail.
Total Length (cm) - This numeric variable is the measured length from the tip of the snout to the end of the longest part of the tail.
Weight (kg) - This numeric variable is the body weight of the fish.
Condition Factor (K) -This numeric variable is how heavy the fish is for its length, calculated as 100,000 × weight ÷ fork length³. Higher value means a plumper fish.
Activity
Part 1: Get to know the data
Make a histogram of Fork Length (cm). Show Fork Length (cm) on X and choose the rectangle based family of graphs.

Screenshot and paste your graph below:
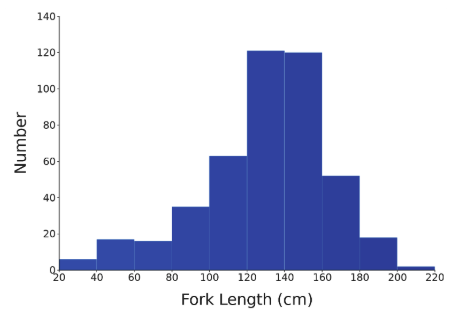
2. Which bin in the histogram of fork lengths has the most fish? Note that you can hover your pointer over any bar to see the total count.
3. Describe the shape of the histogram. Is it symmetric, or does it have a longer tail on one side?
4. Adult Gulf sturgeon are usually longer than about 120 cm. Use your histogram to estimate whether most of the fish caught were adults or young fish. Explain how you decided.
Part 2: How does weight change with length?
5. Predict: if one sturgeon is twice as long as another, will it be about twice as heavy, or more/less than twice as heavy? Explain your thinking.
6. Make a scatterplot with Fork Length (cm) on the x-axis and Weight (kg) on the y-axis. Choose the dot and line family of graphs.
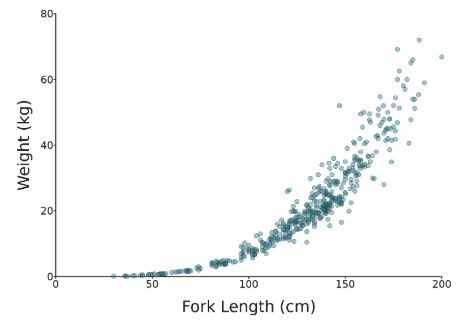
7. Describe the relationship you see in the graph. As fork length increases, what happens to weight? Do the points follow a straight line or a curve?
8. Use your graph to estimate the weight of a typical 100 cm sturgeon and a typical 150 cm sturgeon. The longer fish is only 1.5 times as long. About how many times heavier is it? Why might weight increase so much faster than length? (Hint: a fish gets longer, wider and taller as it grows.)
Part 3: Are the sturgeon the same size in every river?
The eight rivers in this study run from the Pearl River (Louisiana–Mississippi border) in the west to the Suwannee River (Florida) in the east.
9. Make a box plot with River on the x-axis and Fork Length (cm) on the y-axis. You will stay in the dot and line family of graphs to do this.
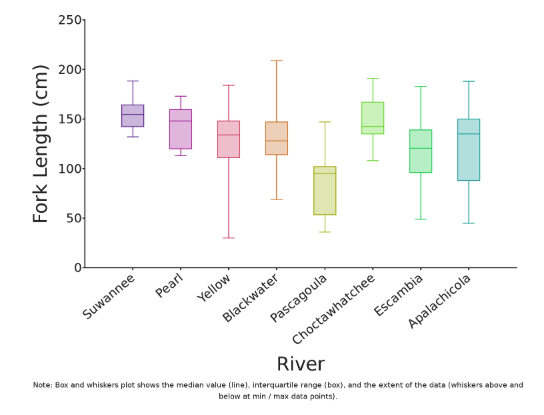
10. Which river has the longest fish (highest median)? Which river has the shortest fish (lowest median)?
11. Give one possible reason why fish from different rivers might be different sizes.
Part 4: Do sturgeon gain weight over the winter?
Remember: Gulf sturgeon eat very little during the summer in rivers and feed in the Gulf during the winter. The fall fish were caught before their winter in the Gulf. The spring fish were caught after.
12. Predict: which group of fish will be plumper for their length (higher condition factor), the Fall 2010 fish or the Spring 2011 fish? Explain why.
13. Make a mean bar graph with Season on the x-axis and Condition Factor (K) on the y-axis. You will need to switch from Median based to Mean Based descriptive stats to the right of your graph to switch from box plots to bars.
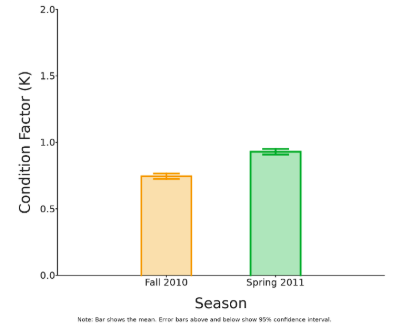
14. What is the mean condition factor for each season? What does that tell you about how different the two groups are?
15. The spring fish were also a little longer on average than the fall fish. Why is it better to compare condition factor than to compare weight when asking whether fish are better fed?
Part 5: Put it together
16. Write a claim, evidence and reasoning (CER) paragraph that answers this question: Do Gulf sturgeon gain body mass while they spend the winter in the Gulf of Mexico?
Claim: Answer the question in one sentence.
Evidence: Use numbers from your graph in Part 4.
Reasoning: Use what you know about where sturgeon feed to explain why the evidence supports your claim.
17. This study compared different fish in fall and spring. Some fish were caught in both seasons. If you were the scientist, how could tracking the same fish over time make your conclusion stronger?