A simple, repeatable classroom activity that teaches students to read, interpret, and evaluate any graph.
Graph literacy is one of the most important skills in science education — and one of the most underpracticed. Students spend hours learning to make graphs, but rarely get structured practice reading them cold, without context, the way they'll encounter data in the real world.
Graph Lab is a free weekly activity designed to fix that. Each week, share a set of real scientific graphs with students. Three consistent questions guide the analysis. No prep, no special tools, no prior knowledge required.

Why the same three questions every week?
Repetition is the point. The framework becomes automatic. By mid-year students are applying it to graphs they encounter outside of class — in the news, in their textbooks, on social media.
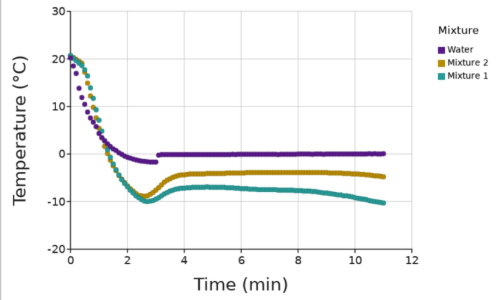
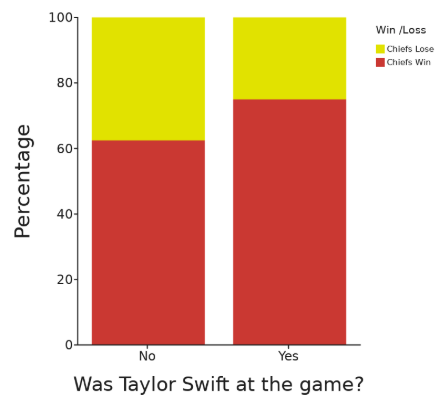
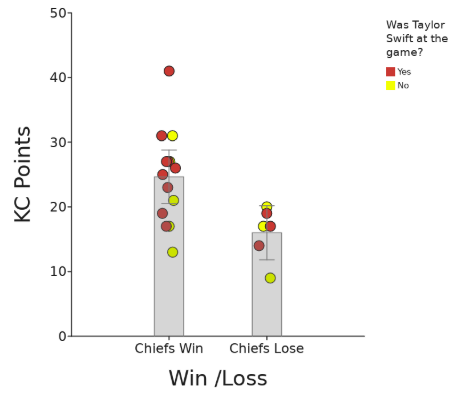
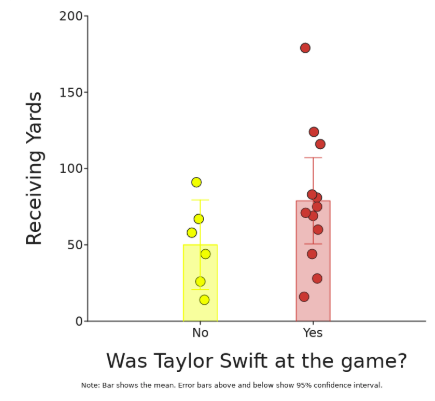
The questions are also graph-agnostic. They work equally on scatter plots, histograms, bar charts, and line graphs. Use one, two, or all three of the questions. Change it each week or keep it routine.
What is included with each Graph Lab slide deck?
Each graph comes with 5 slides:
One slide with all 3 questions together
Three slides with one question each, for easy use or modification
A final slide with the full lesson plan preview (you can read about the dataset background, and view other related graphs), and a direct link to the dataset and Classroom-Ready activity in DataClassroom.
Getting started
Graph Lab is free and updated regularly. Click on any graph below to get your own editable slide deck.
Graph requests? We love them. Email info@dataclassroom.com to let us know what you’re looking for.
Looking for the answer keys? Request through the form, below: