Community Water Quality Data
These data were collected through community efforts to engage with local water quality near Brunswick, Georgia in conjunction with Adopt-a-Stream.

Background:

The Safe Water Together Glynn County Project (SWTGC) began after Georgia Southern University’s Institute for Water and Health was approached by a concerned member of the county government in Glynn County, Georgia. More people had begun catching and consuming fish from nearby Terry Creek. This was concerning because Terry Creek is part of what is known as a Superfund site within Glynn County.
The Comprehensive Environmental Response, Compensation, and Liability Act is the law that allows the EPA to both hold industries responsible and fund the cleanup of sites that have become so polluted that they are a danger to humans. When this law is used the site of the cleanup is known as a Superfund site.
Between 1948 and 1980 there was a pesticide factory that operated near Terry Creek in Glynn County. That site became contaminated with a pesticide called toxaphene because the factory owned by Hercules Inc discharged wastewater through a ditch that carried the waste into nearby streams. The wastewater was discharged like this for many years. Occasionally, the U.S. Army Corps of Engineers dredged the area. The soil that was dredged (known as dredge spoil), which contained much harmful waste from the factory, was placed at the point where Terry Creek merged with nearby Dupree Creek and made its way further into the local environment.
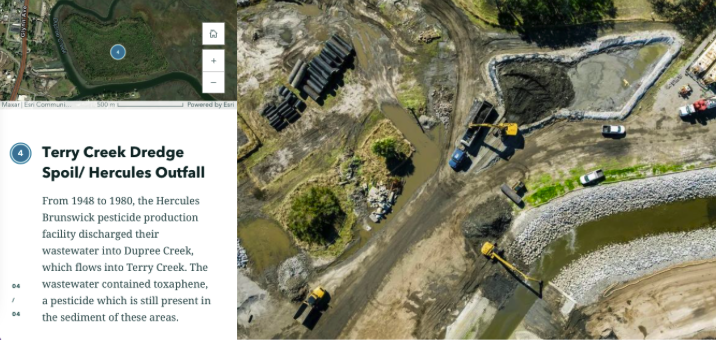
Images above and below are from Georgia Southern University’s Superfund Story Map under “What is a Superfund?” found here.
In 1997 the Terry Creek Dredge Spoils/Hercules Outflow site was designated as a Superfund site through the Superfund Alternative Approach and Hercules Inc began efforts to assist with cleaning up the site. This site is just one of 4 superfund sites in Glynn County, Georgia.

Site 1 - Brunswick Wood Preserving Co
Site 2 - Hercules 009 Landfill
Site 3 - LCP Chemicals
Site 4 - Terry Creek Dredge Spoil / Hercules Outfall
Given this history of industrial pollution in the area, the Safe Water Together Glynn County Project sought to “cultivate a sense of self-efficacy within the community” as it engaged local citizens directly in collecting water quality data from their nearby streams. To do this, a community-academic partnership was begun between community volunteers, leaders in the community, and the Institute for Water and Health at Georgia Southern University. In this partnership, community volunteers would become trained to collect water quality data from nearby rivers and streams. Although these data do not measure the kind of industrial pollution such as toxaphene that is frequently measured as part of the Superfund cleanup efforts, the data collection process allows local community members to engage with water-quality data in their local environment. This hands-on environmental education taking place in a community owned lab space helps to build awareness in the community of the kinds of water quality issues that have been part of the history of Glynn County. It also helps to create a better informed community for policy decisions,
Community volunteers were trained using the Georgia Adopt-a-Stream protocols and began recording the data on the kinds of often fluctuating water parameters that are associated with the immediate health of the water. These include measurements such as dissolved oxygen, pH, conductivity, and salinity. Let’s take a closer look at the data collected by these community volunteers to get practice in reading this kind of water quality data.
You can further explore the story behind this dataset through a storymap produced by Georgia Southern University’s Institute for Water and Health.
Dataset
These data were collected from six different locations around Glynn County by volunteers in the Safe Water Together Glynn County Project (SWTGC). Four of the sites were chosen based on their proximity to the four Superfund sites. Two of the sites were chosen because they are popular local fishing locations downstream of the Superfund sites.
Data were collected after SWTGC volunteers received an Adopt-a-Stream training session. Volunteers were trained and certified to collect water quality data using EPA-approved protocols. Georgia Adopt-A-Stream is the largest volunteer water quality monitoring organization in the State, and participants must pass written and field exams to be able to collect and enter data into the system. More information can be found at Adoptastream.georgia.gov.
Data were collected at each of the six sites on six different dates ranging from May 15th to July 24th in 2024. Each row in the dataset represents one water collection event at a single location on a specific day.
The site names in the activity have been changed from their official location names on the AAS site. This change was made for clarity on which superfund site the stream data is closest to. Below, find the site names as listed on the AAS site alongside the names we have used in the activity.
S 7880 - “Cypress Mill Creek” (Brunswick Wood Preserving Co)
S 7879 - “Terry Creek” (Hercules 009 Landfill)
S 7881 - “Lanier Pond” (LCP Chemicals)
S 7878 - “Overlook Park” (Terry Creek Dredge Spoil)
S 7882 - “Brunswick Marina” (Brunswick Marina)
S 7883 - “East River” (East River)
Variables
Date - This informational column records the date the samples were collected in month/day format. These data have been classified as info and cannot be used on your graphs.
Numeric Day - This numeric variable is the day of the year the samples were collected. January 1 has a value of “1” and December 31 has a value of 365. This dataset has values ranging from 136 (May 15) to 206 (July 24). Measured in days.
Site - This categorical variable lists the name of the location of sampling. Values include Brunswick Wood Preserving Co, Hercules 009 Landfill, LCP Chemicals, Terry Creek Dredge Spoil, Brunswick Marina, and East River. Some of the values will use shortened labels when they appear on graphs.
DO (mg/L) - This numeric variable represents the amount of dissolved oxygen in the sample. Measured in milligrams per liter.
Air Temp (°C) - This numeric variable measures the air temperature at the collection site. Measured in degrees Celsius.
pH - This numeric variable references the pH levels measured in the water sample. There are no units.
Conductivity (µs/cm) - This numeric variable measures the conductivity of sampled water. Measured in microSiemens per centimeter.
Salinity (ppt) - This numeric variable references the value of salinity of the water sample. Measured in parts per trillion.
Water Temp (°C) - This numeric variable measures the water temperature at the collection site. Measured in degrees Celsius. It was measured near the surface, in the shade, as directed as best practices.
Note on limitations of these data
The water quality data in this dataset only represent a snapshot in time. Data collected at sample sites reflects only what is happening at that spot at that time. Scientists collect more data over time to establish baselines for the area that can show variations in seasonal changes. Baseline data also help scientists identify when something is out of the ordinary. Additionally, the water chemistry data collected by Adopt-A-Stream protocols is not suitable for answering all water-quality questions.
Activity
Part 1: Explore the dataset
1.Make a graph to compare the number of samples collected at each site.
Make a graph showing just the variable called Site. For this graph you can select any of the three basic graph types to do this using the icons that look like this:

Screenshot and paste your graph below:


2.Looking at the above graph that you made, how many water samples were collected at each of the six locations?
3. Make a graph to show the range of time of which the data were collected.
Make a graph showing just the variable called Numeric Day on the Y axis. For this graph you should use graphs made with dots and lines by using this icon:

Screenshot and paste your graph below:
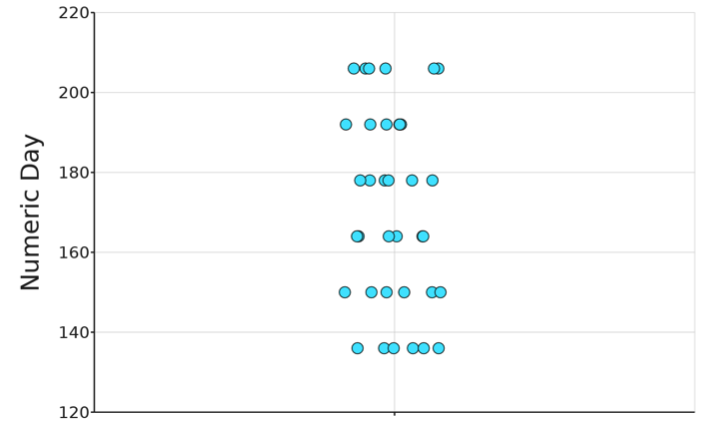
4. What time of year were these data collected? You can hover on the data points in your graph to see the date for each sample.
Part 2: Examine change over time data
5. Make a graph of Numeric day on the x-axis and DO (mg/L) on the y-axis. Select Site as the z-axis (color coding) variable. Check the box to the right of the graph to Connect the dots with lines.
Screenshot and paste your graph below:
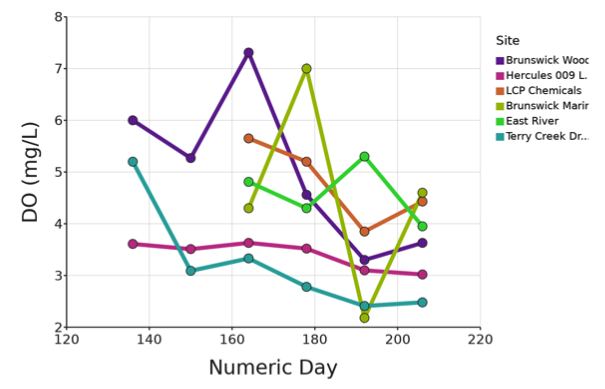
6. What is the range of values for dissolved oxygen that is observed over the time period seen in the graph across all the locations? When and where were the highest and lowest values recorded?
7. Is there a general trend in values of dissolved oxygen over the time period shown in this graph?
Describe the data and any trends you see in the graph above .
8. Rivers that have large amounts of decaying organic matter often have a dark, tea like color due to tannins and are known as blackwater rivers. These blackwater rivers have active bacteria working to decay the organic matter and often leads to lower pH and dissolved oxygen within the river. Dissolved oxygen levels in a blackwater river can be below 5.0 (mg/L).
Even though fish usually only thrive with higher DO levels and would be stressed in levels below 5, fish in Blackwater systems have adapted over time to living in environments with low oxygen levels.
Based on DO levels from your graph above, do you see evidence that the sampled streams around Brunswick are blackwater streams? Provide evidence for your answer.
9. Now make a graph of Numeric Day vs. Water Temp by switching the y-axis to Water Temperature. Keep Site on the z-axis, and keep dots connected.
Screenshot and paste your graph below:
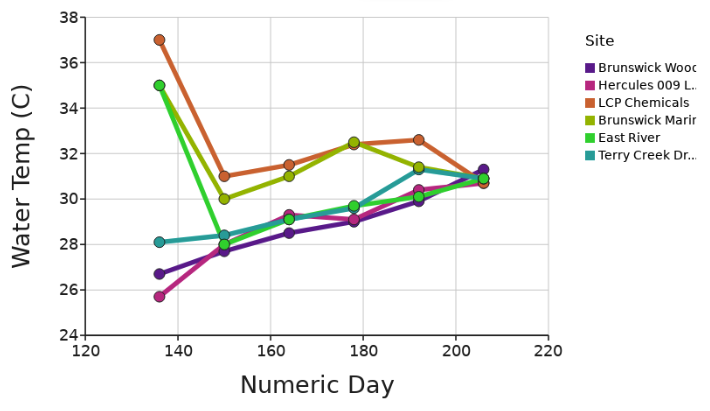
10. Is there a general trend in values of water temperature over the time period shown in this graph?
If yes, describe the trend.
If no, describe what you are seeing that does not qualify as a trend.

11. Make a graph of Numeric day on the x-axis and pH on the y-axis. Keep Site as the z-axis variable. Screenshot your graph below:

12. What do you notice about the general trend in pH over this time period?
13. Given that the normal range for pH in blackwater river systems ranges from 3.5 to 6.0 while a typical river has a pH range of 6.5 to 8.5, do the pH values at these locations seem surprising?
Explain your thinking and refer to the data as evidence.
14. Make a graph of Numeric day on the x-axis and Salinity (ppt) on the y-axis. Keep Site as the z-axis variable. Screenshot and paste your graph below:

15. How does salinity change over the period of time recorded in the dataset?
16. Which site shows the most change in salinity over time? How much does it change over the time shown in the graph.
Part 3: Examine a correlation
17. Make a graph of Salinity (ppt) on the x-axis and Conductivity (µs/cm) on the y-axis. Clear the z-axis variable. Check the box for Regression line to add a line of best fit.
Screenshot and paste your graph here:
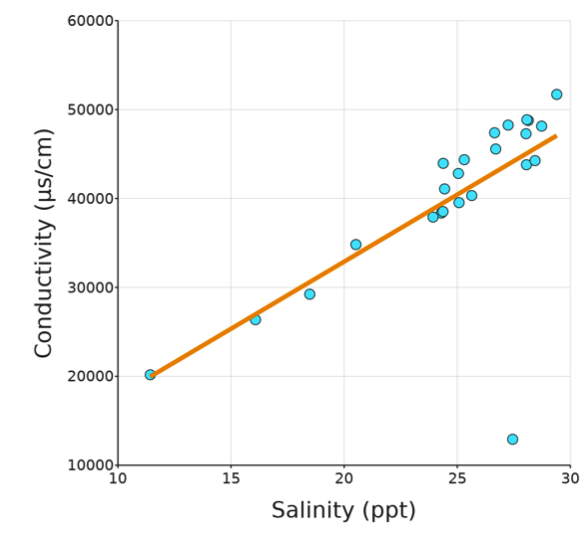
18. Describe the general relationship between Conductivity and Salinity.
19. Look at the graph to identify an outlier in terms of Conductivity in the dataset. What is the value of Conductivity for that data point? Based on the line of best fit, what would you have expected as a value of Conductivity for that data point simply given its value for Salinity?