Blinking Out?


This dataset and content is provided our by our friends at Data Nuggets. Visit DataNuggets.org to see the original activity and additional materials
Featured scientists: Christie Bahlai and Julia Perrone from Kent State University


Check out Julia’s full profile here on Project Biodiversify
Background:
The longest survey of fireflies known to science was actually started by accident!
At the Kellogg Biological Station Long-Term Ecological Research Site, scientists work together to answer questions that can only be studied with long-term data. Their focus is to collect data in the same way over many consecutive years to look for patterns through time. One of these long-term studies, looking at lady beetle populations, was developed to keep watch on these important species. To count lady beetles, scientists placed yellow sticky card traps out in the same plots year after year. These data are used to figure out if lady beetle numbers are changing over time.

A technician recording data from sticky traps in the field. If you look at the lower, right hand side of the photo you can see a firefly that was caught! Photo Credit: K. Stepnitz, Michigan State University

All the insects collected on a yellow sticky card trap over the course of one week. Photo credit: Elizabeth D’Auria, Michigan State University
Because sticky traps catch everything small that flies by, other insect species get stuck as well. One day, a research technician noticed this and decided to add a few new columns to the data sheet. That way they could start recording data on the other insect species found on the sticky traps. Each year the technician kept adding to the record and over time, more and more data were collected. One of those new columns happened to record the number of fireflies caught. Though the exact reason for this data collection is lost to history, scientists quickly realized the value of this dataset!
Several years later, Julia became the lab technician. She took over the responsibility of the sticky trap count, adding to the dataset. Christie joined this same lab as a scientist and stumbled upon the data on fireflies that Julia and the previous technician had collected. She wanted to take advantage of the long-term data and analyze whether firefly populations had been increasing or decreasing.
Many people have fond memories of watching fireflies blink across open fields and collecting them in jars as children. This is one of the reasons why fireflies are a beloved insect species. Julia grew up in southwest Michigan and fondly recalls spending summers watching them blink over yards and open fields, catching them in jars to watch them for a little while. Christie did the same in her parent’s yard in rural Ontario! That fondness never really went away and both enjoy watching the fireflies around Northeast Ohio where they currently live. Fireflies are also an important part of the ecosystems where they live. Larvae spend most of their time in the soil and are predators of insects and other small animals, such as snails.
Many scientists and citizens alike have noticed that they aren’t seeing as many fireflies as they used to. Habitat loss and light pollution could be causing problems for fireflies. This is where the importance of long-term data really comes into play. Long-term data are critical to identifying and understanding natural population cycles over long periods of time that we wouldn’t be able to see with just a few years of data. It also gives scientists opportunities to answer unanticipated research questions. In this situation, even though the data were collected without a specific purpose in mind, having the dataset available offered new opportunities! Christie and Julia were able to look at the long-term changes in southwest Michigan firefly populations, something they would not have been able to do before the research technician added those extra columns. In order to start answering this question, they compiled all of the years of firefly data and began to compare the average counts from year to year. Although data were collected in multiple different habitat types, they focused on data from open fields because fireflies use these areas to find mates.
Scientific Question: Are firefly populations in Southwest Michigan in decline?
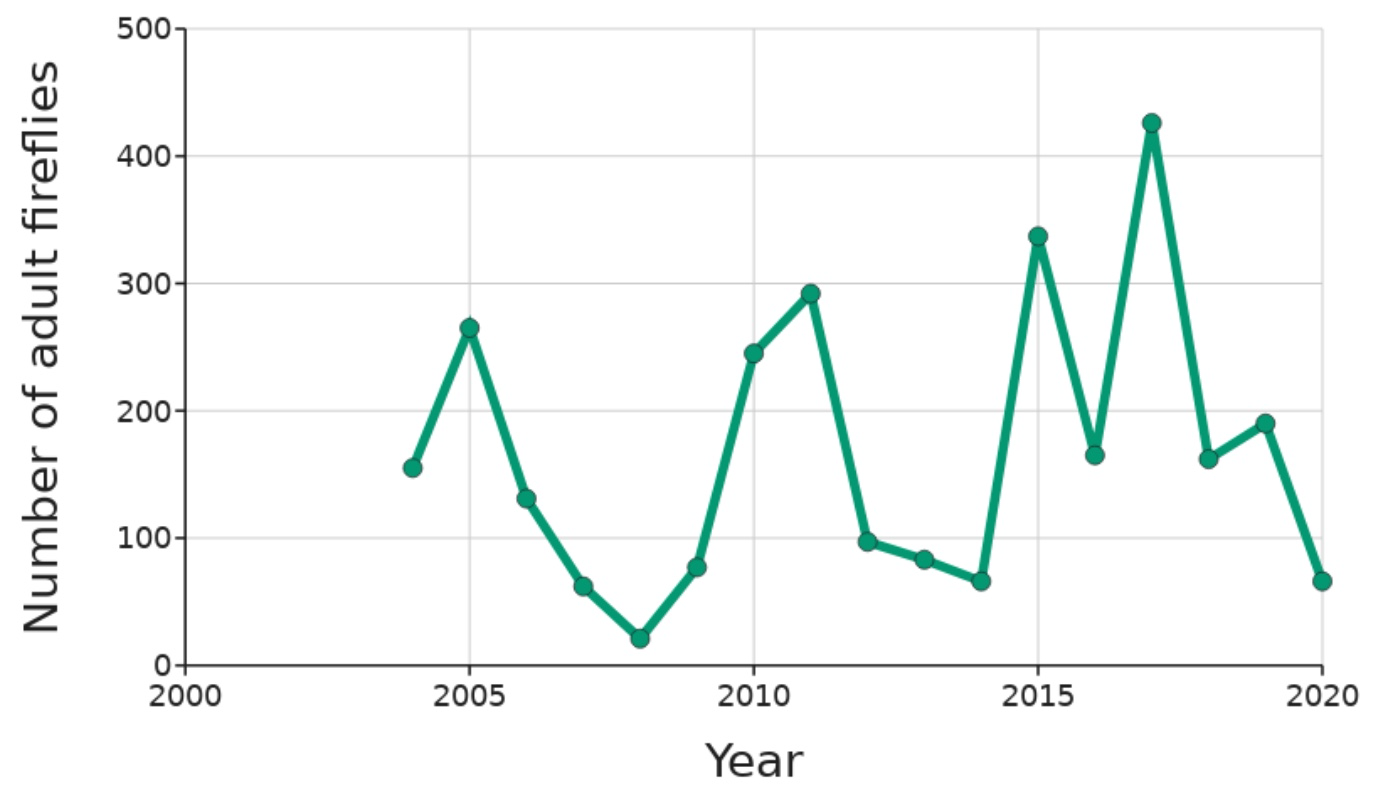
Scientific Data:
When Christie and Julia were preparing the firefly dataset to analyze, they noticed that the number of traps put in the fields varied each year. There are many factors that affect data collection, and one of them is sampling effort. Some variables that would determine sampling effort would be how many traps are set out, how often, the amount of time they are left in the field, and where they are placed. The number of traps set out wasn’t always consistent across years. So, to account for the difference, the number of traps used was always recorded to account for sampling effort on the raw data collected.
Click on the graph tab, and explore the available variables. What data will you graph to explore the first hypothesis? Independent variable:
Dependent variable:Create the graph of your data, and paste your graph below:
3. Identify any changes, trends, or differences you see in your graph. Write one sentence describing what you see.
Interpret the Data:
4. Make a claim that answers the scientific question.
5. What evidence was used to write your claim? Reference specific parts of the tables or graph.
6. Explain your reasoning and why the evidence supports your claim. Connect the data back to what you learned about the value of long-term data collection.
Your next steps as a scientist:
7. Science is an ongoing process. What new question(s) should be investigated to build on Christie and Julia’s research? How do your questions build on the research that has already been done?
8. What future data should be collected to answer your question?
9. What hypothesis are you testing in your experiment? A hypothesis is a proposed explanation for an observation, which can then be tested with experimentation or other types of studies.

These questions are a digital extension of the original Data Nuggets activity. The data manipulation and graphing tasks within are best completed here on DataClassroom.
Part 1: Value of long-term sampling
10. Typically, if long term data for populations is not collected, we may not get an accurate picture of whether the population is increasing, decreasing or is stable. To test this out for yourself, try plotting firefly abundance over any two years of your choice. To do this, exclude all rows of data except any two data points
11. Create a graph of your data and paste below:

12. Describe whether the population is increasing, decreasing or is stable with time
13. How does this compare to the trend you observed in abundance of fireflies when you sampled across all years in the previous graph?
14. Repeat this exercise, but now by including two other datapoints. You could also compare your results with that of a friend in the class. Based on these inferences, explain why long-term data collection may be important to understand the abundance of fireflies in particular, and insects in general.
Part 2: Sampling Effort
15. One possible issue with our total population tallies is that different amount of traps were collected each year. Make a graph to compare number of traps vs. number of adult fireflies, and paste it below:

16. If the number of fireflies counted was influenced by the number of traps,what kind of graph would we expect to see? Is that what the data in the previous graph is showing us?
17. What is our actual data saying?
18. Let’s make one more graph, however this time we will consider the number of fireflies captured regardless of the number of traps. On your graph, first show the variable Adult fireflies/trap and put it on your y-axis. Show Year on the x-axis. Paste the graph below:

19. Do the trends in this graph generally match the trends you talked about in #3, or appear different? If it is different, describe what trends you see in this new graph.
20. Which graph do you think we should use to make our claim, because it reflects the firefly population trends most accurately?
Want an Answer Key? Fill out the form below.
This dataset and content is provided our by our friends at Data Nuggets.
Visit DataNuggets.org to see the original activity and additional materials
