
How to: Mean Bar Graph
How do I add a mean to my graph?
Once you have created a dot plot or a histogram, it is a simple task to add visuals to show descriptive statistics like mean and median, with or without error bars. In any dataset that has a numeric Y axis the 'Descriptive stats' option will appear in the box to the right of your graph. Begin your selection by checking that box.
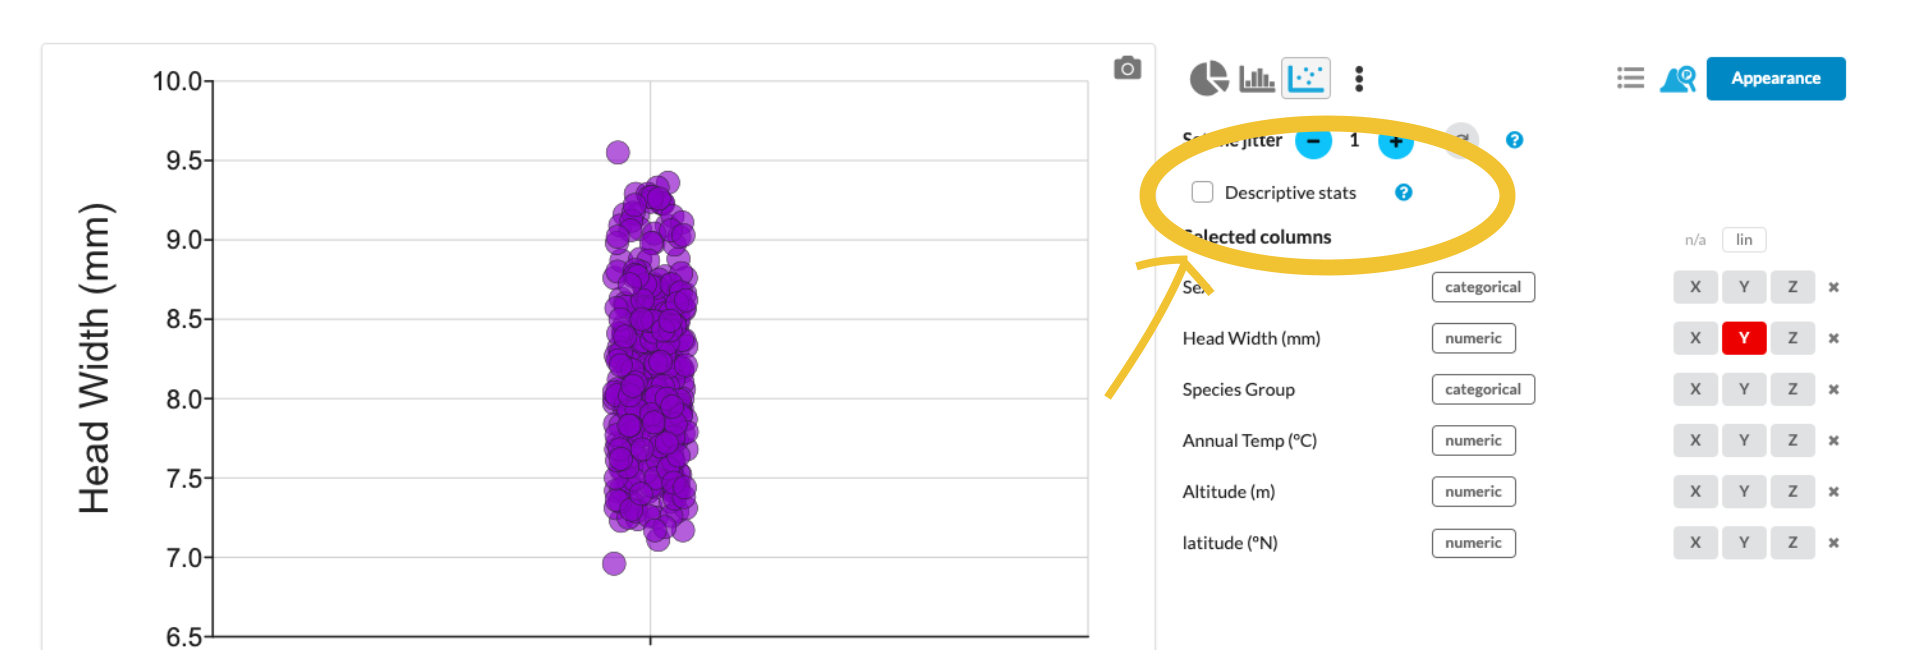
Once you have checked the box, several options will appear. You will have the choice of showing mean, median or both.
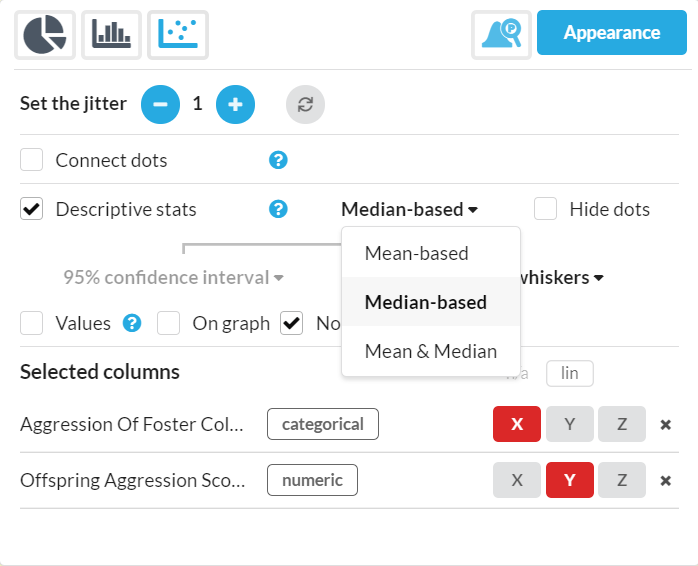
For Mean-based statistics you will see a drop down menu for the measure of uncertainty to display: standard deviation, standard error of the mean (SEM), SEM x 2, or the 95% confidence interval (CI95). Also offered are Half Range (aka Semi Range) and Mean Deviation error bars.
You may also choose to show both Mean & Median on your graph. You will have access to all choices for both categories
Once you select your choices, you will see the visuals appear on your graph.
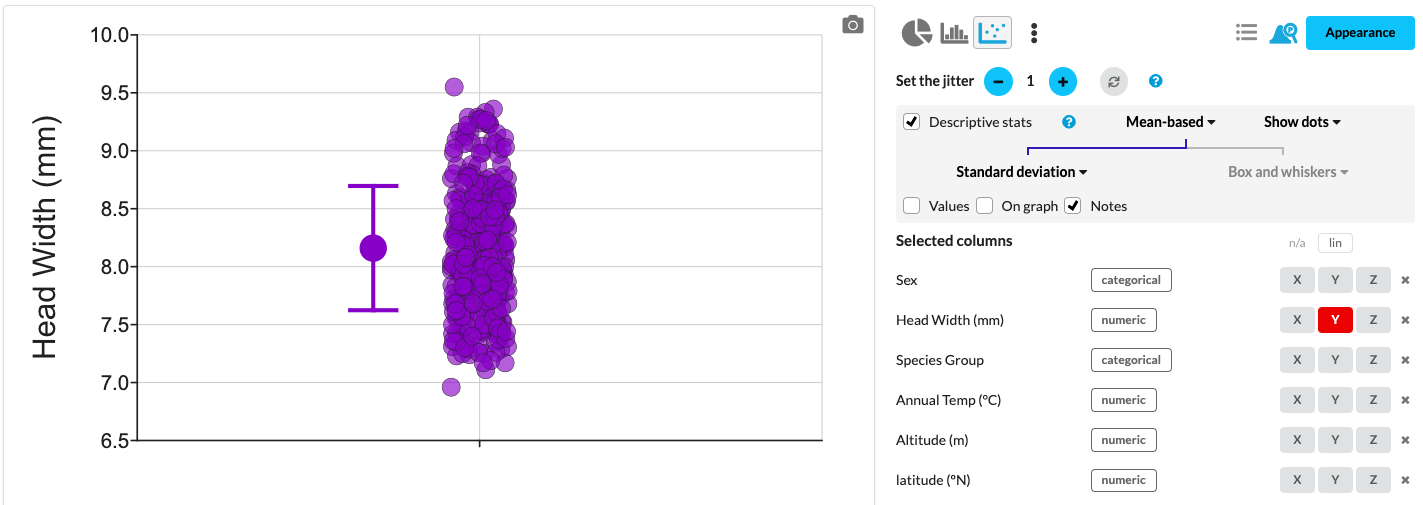
You also have the option to show the values on your graph or in the window just by checking the Values box. This will show a table of the numerical values for mean, median, 95% confidence interval, and so on.
Highlighting outliers can also be done: in this case, the descriptive stats annotation is shown (boxplot or mean/error bars) and just the data points that a calculated to be outliers. See the outliers article for more detail.
What other options do I have to tell my data story with mean?
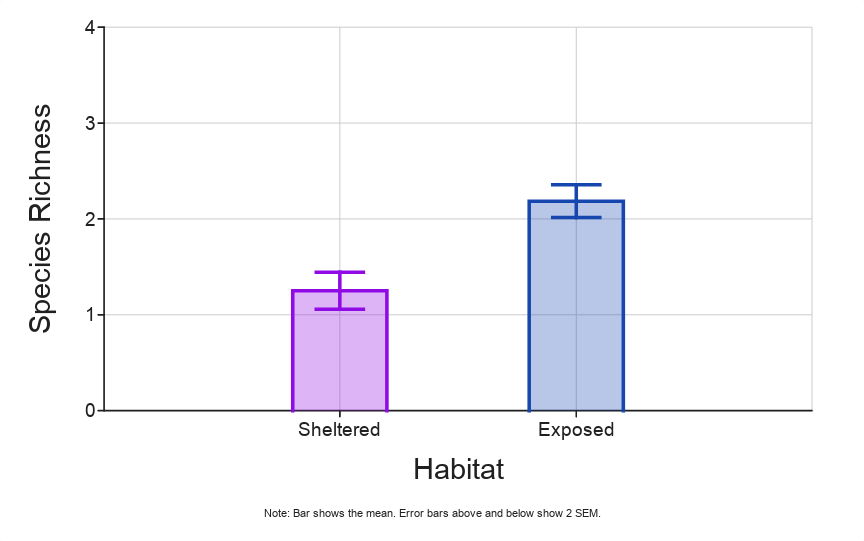
There are other options for showing the mean. When the Y axis includes zero, a bar with error bars / whiskers is also an option:
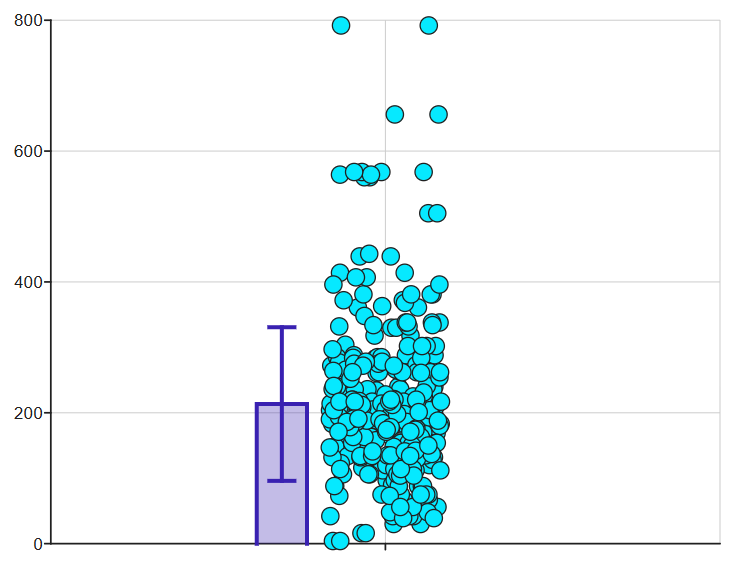
That's the closest we get to a "bar graph of the mean". You can turn off the Show dots option if you want, though we don't recommend it.
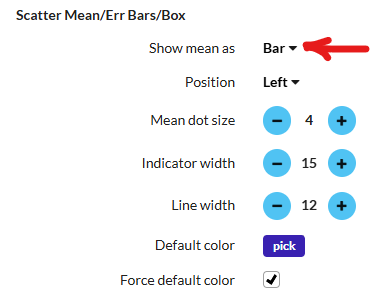
Find these options in the Appearance menu, and down in the Scatter Mean/Err bars/box section.
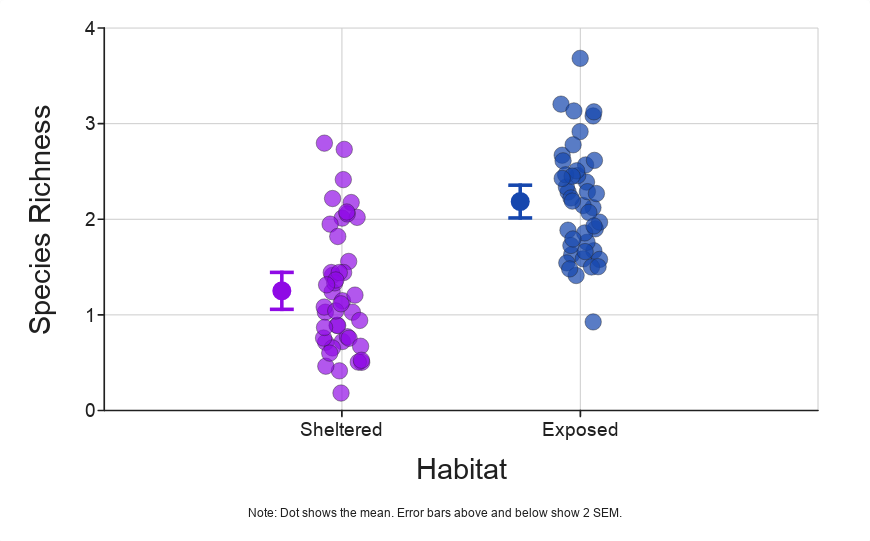
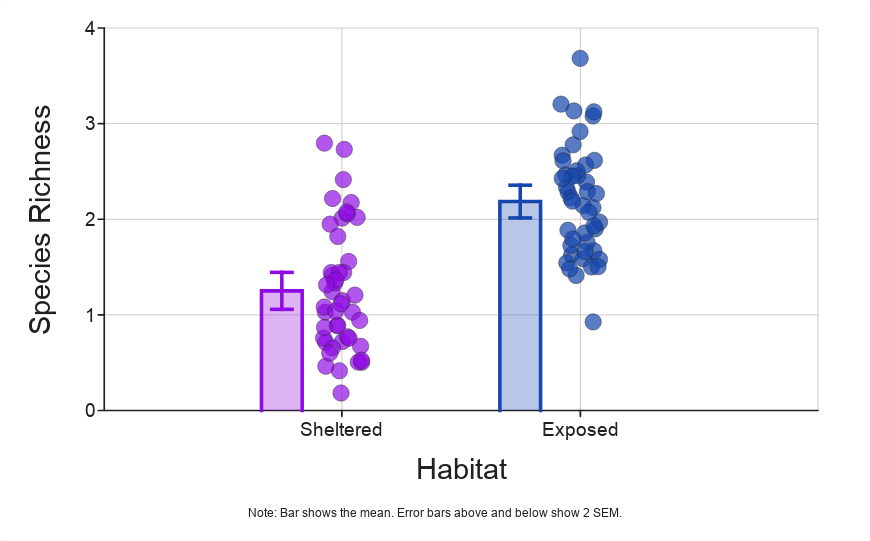
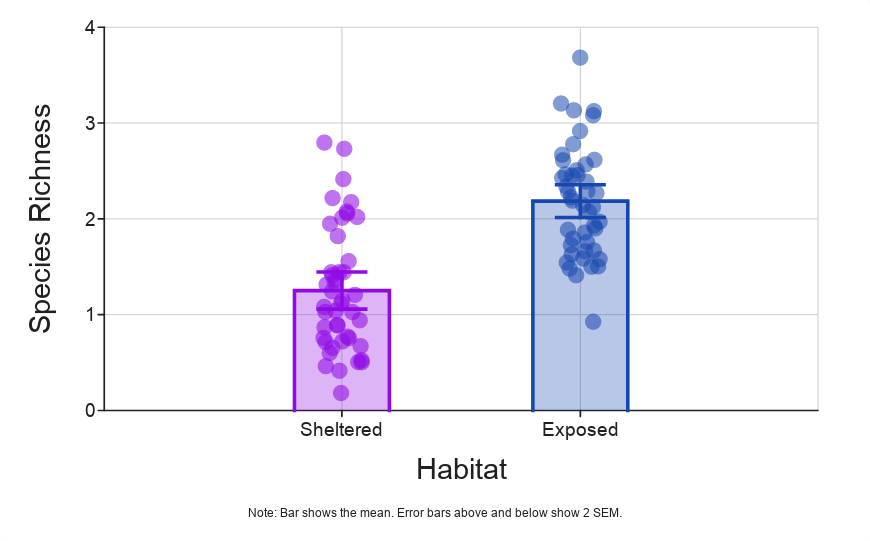
Take a look at some of these examples of the exact same data, below:
Settings for each image, below:
Top Left: Mean as Dot, 2SEM error bars, dots shown
Top Right: Mean as bar set left, 2SEM error bars, dots shown
Bottom Left: Mean as bar and centered, 2SEM error bars, dots shown
Bottom Right: Mean as bar, 2SEM error bars, dots hidden
Need a little more? Here’s a video on how to make it happen. You can also check out our user guide which always has the answers.