Purring Crickets: the evolution of a new cricket song

This dataset and content is provided our by our friends at Data Nuggets. Visit DataNuggets.org to see the original activity and additional materials
Featured scientist: Robin Tinghitella from the University of Denver
Written by: Gabrielle Welsh


Check out Robin’s full profile here on Project Biodiversify
Background:
Animals use many types of mating signals to attract mates. Some of these signals are probably familiar to you, like the bright colors of birds’ feathers, complex courtship dances of fish, and loud calls of frogs. In crickets, males rub their wings together to produce chirping mating songs that attract females. However, in one species of cricket, these mating songs have led to an issue – while they attract females towards the male, they also attract parasitoid flies. These flies kill the crickets by eating them from the inside out! Parasitoids are animals that lay their eggs in another organism’s body. The eggs develop and usually kill the host.

About twenty years ago, scientists discovered male Pacific field crickets in several spots in Hawaii had stopped making songs. By looking at their wings and DNA, scientists were able to find the exact genetic mutation causing their silence. This change in DNA made some crickets to grow with flat wings that made no sound. Males with this mutation are able to escape detection by the parasitoid flies. However, being silent also posed a struggle because flat winged males could no longer use songs to attract female mates. Scientists waited and watched – would a new way to attract females evolve over time, one that is audible to females, but not to the flies?

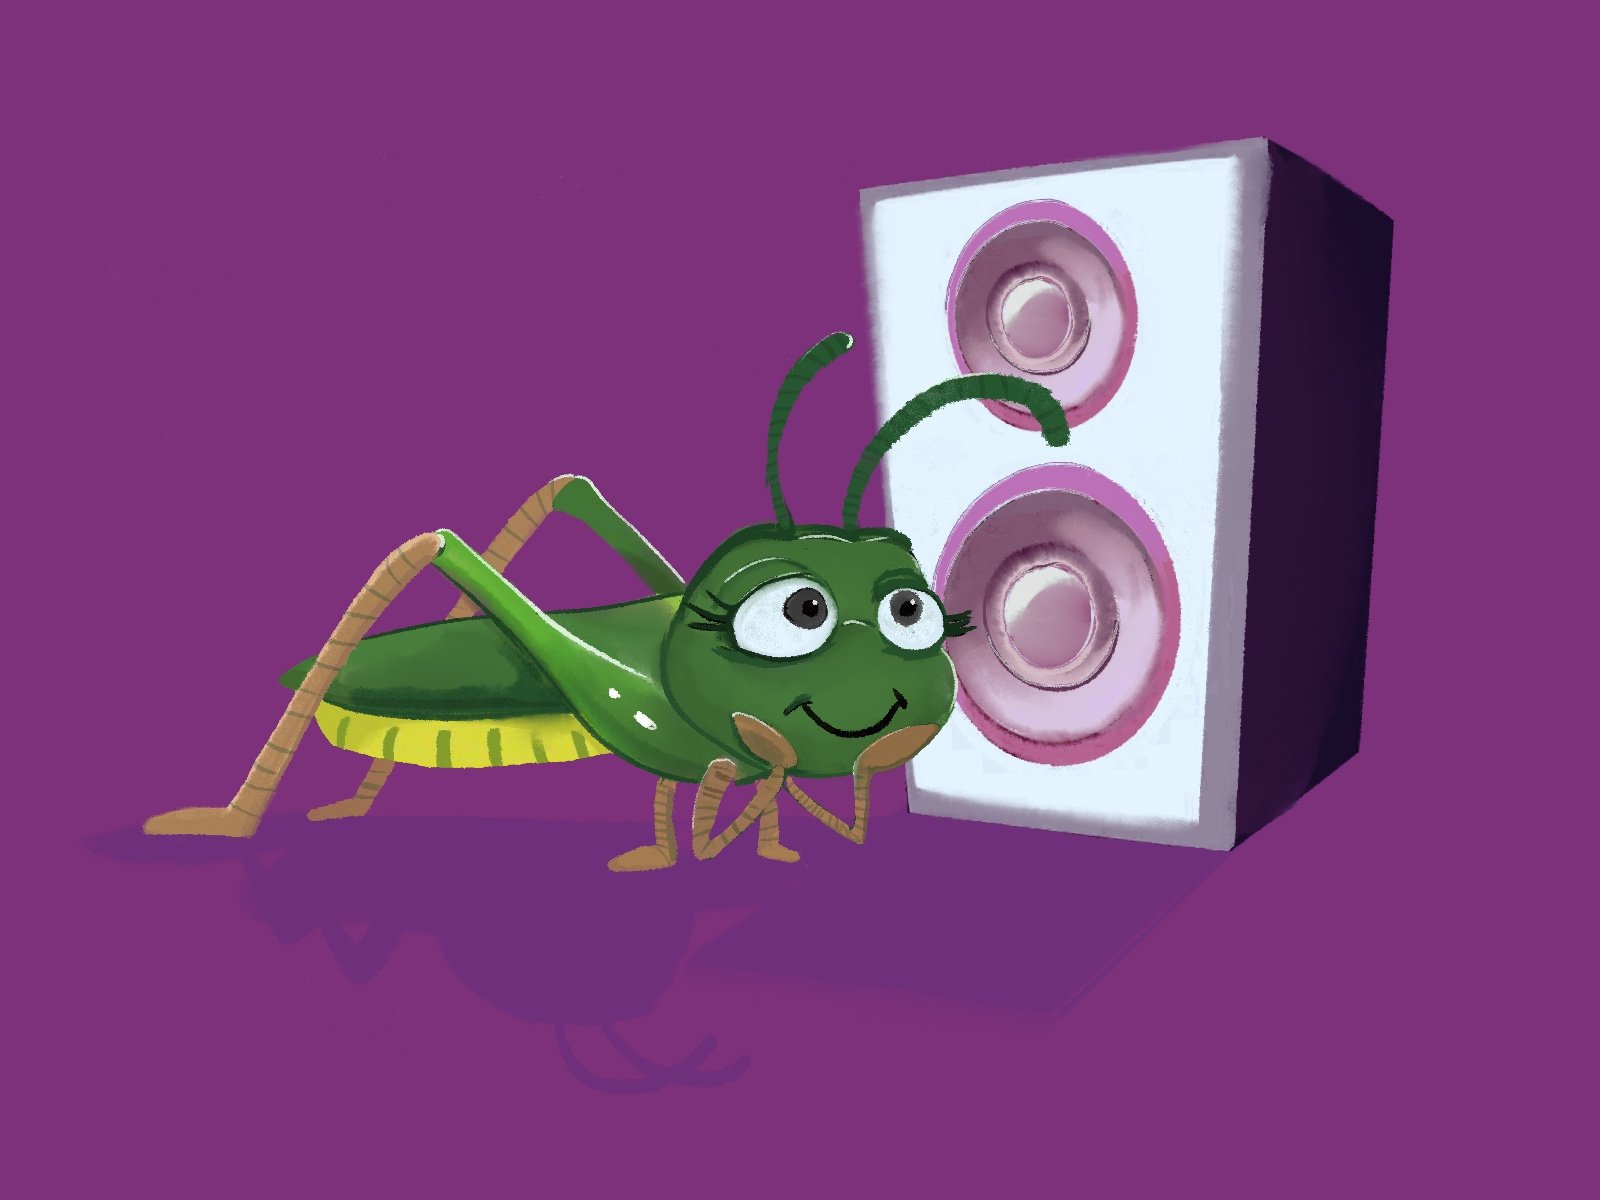
Robin is a scientist who has been studying the mating signals in these crickets for many years. One summer, Robin was working in Hawaii and brought a Tupperware container full of crickets into her room. Suddenly, she heard what sounded like a purring cat, but there was no cat in sight. She soon realized the sound was coming from her container of crickets. This song was unlike anything ever observed before in crickets.
Robin thought that this purring song might be the beginning of the evolution of a novel signal that could be detected by female crickets. If purring is a mating signal, female crickets should have a positive response to purring songs. One way to test this idea is to observe whether females move towards a purring song.
She set out to test her hypothesis with phonotaxis experiments in the lab. During phonotaxis experiments, scientists observe how an organism moves with respect to different sounds. In their first experiment, Robin and her colleagues placed a female at the center of an arena and played a purring song through 1 of 4 speakers. The other 3 speakers were silent. To document the female’s willingness to mate, Robin recorded if the female moved toward the purring and which speakers they contacted. If the purring song was not a mating signal, it should not be attractive to the females and she expected them to contact the speakers at random. This would mean that the purring speaker should be contacted 25% of the time (since only 1 of the 4 speakers broadcast purring). If the purring song was a mating signal, she expected female crickets to contact purring speakers more than 25% of the time.
In a second experiment, Robin investigated whether female crickets prefer purring songs as much as typical mating songs. Using the same set-up, she played either a typical or purring song through 1 of 4 speakers. If females moved toward the speaker playing a song before the silent ones, she recorded the search time. Search time was calculated as the time it took the female to contact the broadcasting speaker minus the time at which the crickets started looking for the speaker. To see whether the purring song was evolving as a mating signal, she compared the time it took crickets to find speakers broadcasting the purring song compared to the typcal mating song. She predicted that if females still preferred the typical song more than the new song, that they would have longer search times for purring versus typical songs.
Scientific Question: Do female crickets respond to a newly evolved purring song as a mating signal? Do they prefer the typical song or the purring song?
We have split this Digital Data Nugget into two parts. Investigate the first hypothesis in part 1, and the second in Part 2.
Scientific Data:
What is the hypothesis? Find the hypothesis in the Research Background and copy/paste it below. A hypothesis is a proposed explanation for an observation, which can then be tested with experimentation or other types of studies.
Click on the graph tab, and explore the available variables. What data from Experiment 1 will you graph to answer the question?
Independent variable(s):
Dependent variable(s):What data from Experiment 2 will you graph to answer the question?
Independent variable(s):
Dependent variable(s):
Create the graph of your data, and paste your graph below:
Experiment 1:
Experiment 2:

For Experiment 2: To find the mean of the data, add descriptive stats, select SEM, and paste it below:

5. Identify any changes, trends, or differences you see in your graph. Include your graph and specifically refer to it when describing those changes, trends, or differences.
Experiment 1:
Experiment 2:
Interpret the Data:
6. Make a claim that answers the scientific question.
7. What evidence was used to write your claim? Reference specific parts of the tables or graph.
8. Explain your reasoning and why the evidence supports your claim. Connect the data back to what you learned about the role canine teeth play for rhesus macaques.
9. Did the data support Robin’s hypothesis? Use evidence to explain why or why not. If you feel the data were inconclusive, explain why.
Your next steps as a scientist:
10. Science is an ongoing process. What new question(s) should be investigated to build on Robin’s research? What future data should be collected to answer your question(s)?

These questions are a digital extension of the original Data Nuggets activity. The data manipulation and graphing tasks within are best completed here on DataClassroom.
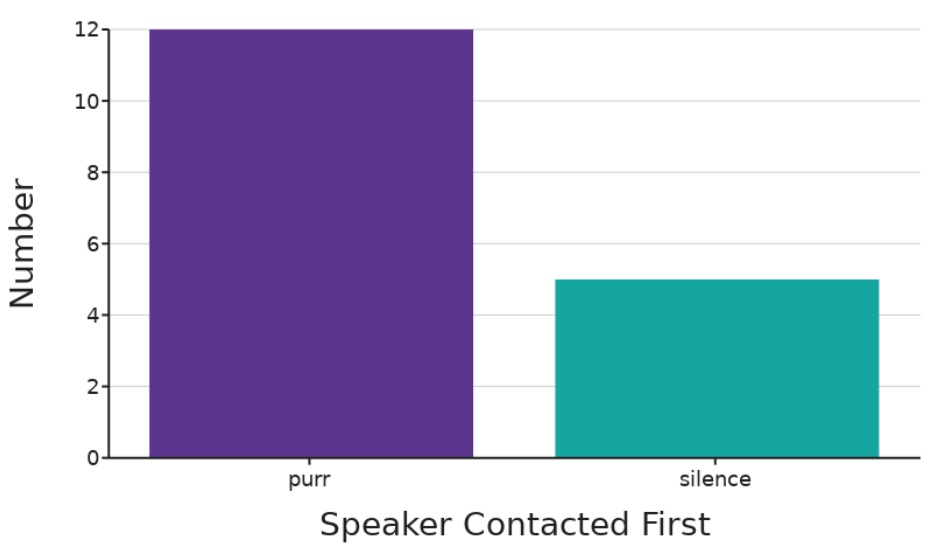
11. In the first graph we see that more females first approach the purr versus those that approached any one of 3 silent speakers, suggesting that females may prefer the purring sound over no sound. You decide to conduct a chi-square hypothesis to test whether this observation is sufficient to reject the null hypothesis. State the null hypothesis.
12. Under the null hypothesis, would you expect an equal number of females to approach the speaker with a purring sound versus one with no sound. State why or why not? If not, what is the expected count? (Note: Since there are 17 females in the experiment, the expectation is likely to be a fractional value in either case).
13. Under what conditions would you reject the null hypothesis?
14. Use appropriate parts of the analysis from either an Interactive Analysis or a Graph-driven tests to state whether you have enough evidence to reject the null hypothesis.
15. Suggest a possible hypothesis test you would conduct to test whether the search time (y- variable) was significantly different for the two song types (purring vs typical) and explain your choice.
16. In Experiment 2, Robin calculated the search time of female crickets when presented with both the purring and typical sound. Looking at the values in the graph in #4 for experiment 2 , you may wonder if females that take longer to respond/search for purring sounds also have a high search time when presented with a typical sound suggesting individual level variability in search times. Create a graph and paste it below to demonstrate how you would visualize such a relationship.

17. Do you think females are repeatable in their search time? Explain why or why not with specific examples in support of your argument. What kind of data would you collect to robustly test this hypothesis?
Want an Answer Key? Fill out the form below.
This dataset and content is provided our by our friends at Data Nuggets.
Visit DataNuggets.org to see the original activity and additional materials
