Crunchy or Squishy? How El Niño events change zooplankton

This dataset and content is provided our by our friends at Data Nuggets. Visit DataNuggets.org to see the original activity and additional materials
Featured scientists: Raisa Hernández-Pacheco from University of Richmond and Damián A. Concepción Pérez from Wilder Middle School
Background:
El Niño events happen every 5 to 10 years and take place in the Pacific Ocean. El Niño occurs when the winds that blow west over the equator temporarily weaken, and even switch direction. This allows warm surface waters that typically pile up on the western side of the Pacific Ocean to flow to the east. In South America, El Niño brings heavy rains and floods because the warm water moves toward that continent. On the other hand, the warm water moves away from the continent of Australia, causing drought. In the U.S., warm waters travel up to California during El Niño years, causing the ocean to be much warmer than usual. El Niño’s effects are so strong that it even changes the marine animals that live off the California coast in those years!

Laura identifies and counts zooplankton from a net tow using a microscope. Laura conducted these identifications while on a research ship at sea.
Laura’s first experience with El Niño came when she was growing up in California. A strong El Niño event hit in 1997-98, and many cities in California flooded because of heavy rainstorms. The event even made the national news on TV! Laura’s second El Niño experience came in 2015, the year she started training to become a scientist. These events had such a big impact on her that she decided to study how zooplankton in the ocean are affected by El Niño. Zooplankton are tiny drifting ocean animals (“zoo” = animal + “plankton” = drifter) that eat phytoplankton (“plant drifters”). Zooplankton are important for the ocean’s food web because they are food for fish, whales, and seabirds.
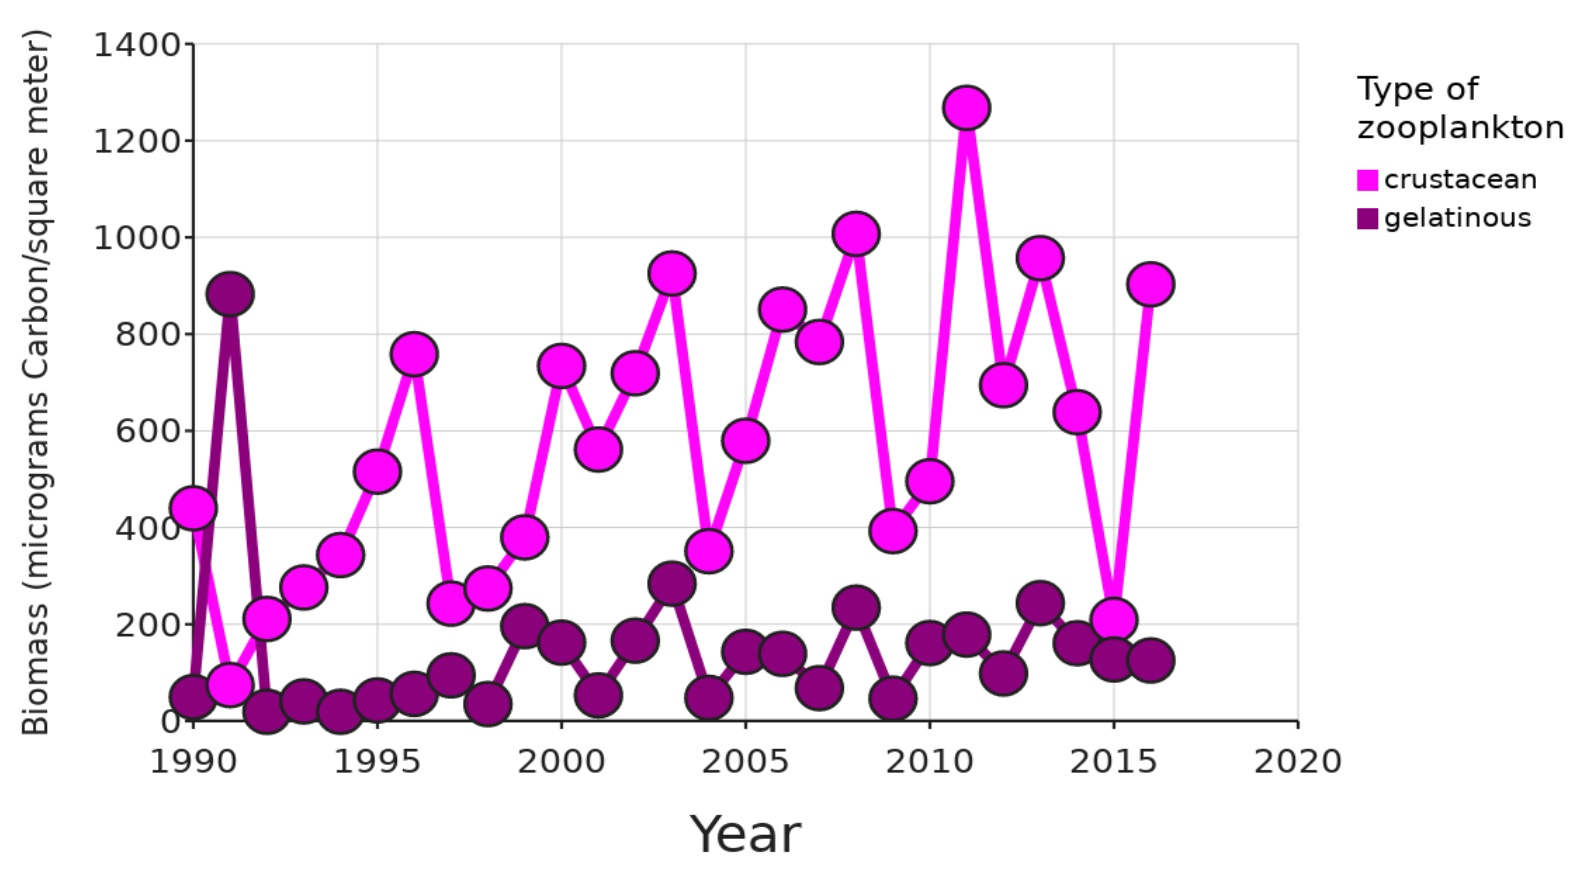
Zooplankton come in many shapes, sizes, and species. The two main groups are crustaceans and gelatinous animals. Crustaceans look like small shrimp and crabs, with hard, crunchy shells and segmented legs like insects. In contrast, gelatinous animals are watery and squishy, like jellyfish. Laura wanted to know how El Niño events might affect which group of zooplankton are found off the coast of California.
Warm ocean waters during El Niño events have lower nutrient levels, so fewer phytoplankton grow leading to less food available for zooplankton. Gelatinous animals can survive in areas of the ocean where there is less food available. They are also able to live in warmer water than crustaceans. For these two reasons, Laura though that gelatinous animals may be able to live in the warmer water off California during El Niño events. Laura predicted that during the El Niño events of 1992-93, 1997-98, and 2015- 16, the balance would shift in favor of gelatinous animals over crustaceans
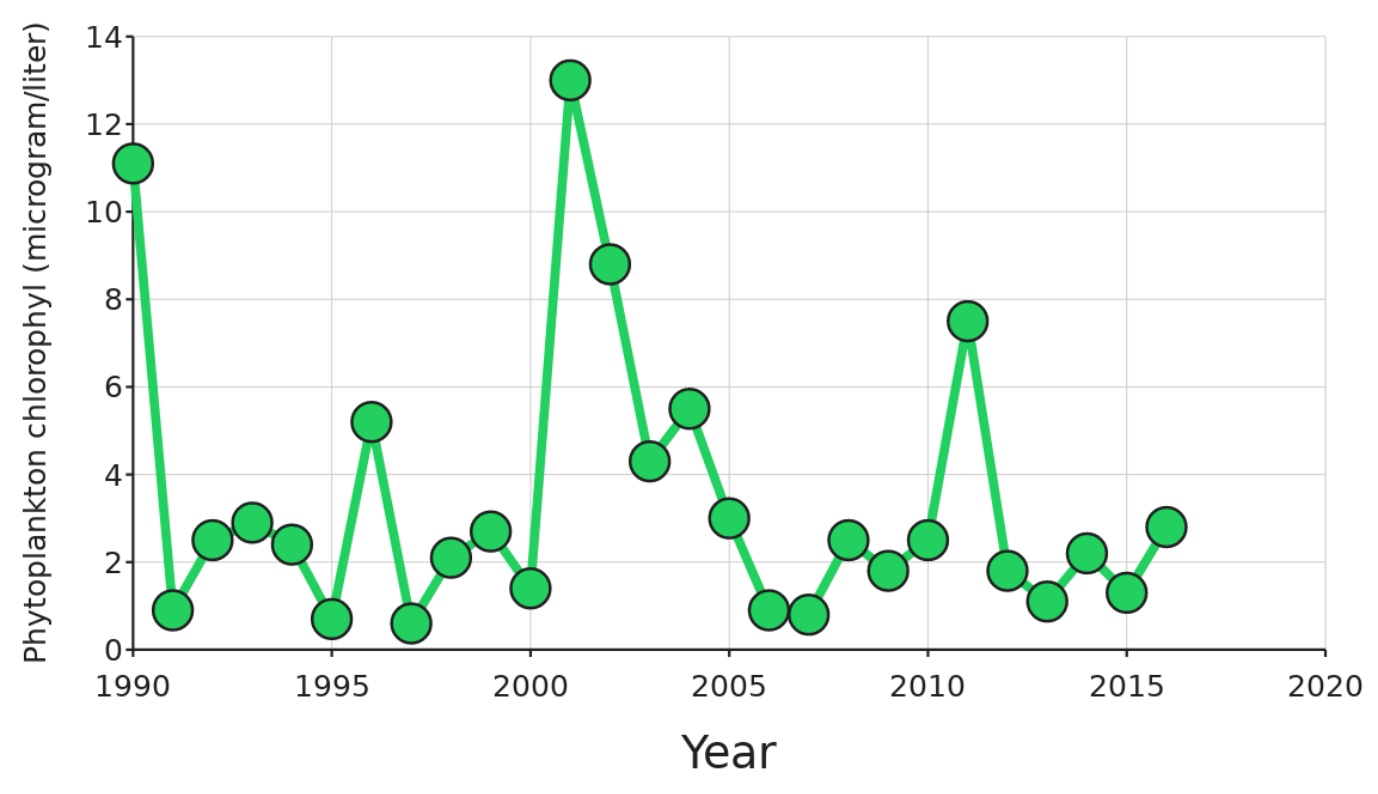
To test her idea, Laura used a long-term dataset that documents zooplankton collected offshore of southern California since 1951. Every spring, a ship goes out on the ocean and tows plankton nets for 30 minutes at 40 different locations. The ship brings back jars full of zooplankton. Scientists look at samples from those jars and identify the species and measure the lengths of each individual zooplankton in the sample. They then add up all the lengths of individual plankton to get the total biomass of each group. Biomass is similar to weight and shows us how big each animal is and how much space their group takes up. Scientists also measure water temperature and how much phytoplankton is found. The amount of phytoplankton is measured by detecting chlorophyll in the water. Chlorophyll from phytoplankton is a measure of how much food is available to zooplankton.
Scientific Question: Do the two main groups of zooplankton (crustaceans and gelatinous animals) increase or decrease in response to changes in their phytoplankton food during El Niño events?
Scientific Data:
What is the hypothesis? Find the hypothesis in the Research Background and copy/paste it below. A hypothesis is a proposed explanation for an observation, which can then be tested with experimentation or other types of studies.
Click on the graph tab, and explore the available variables. What data will you graph to explore the first hypothesis?
Independent variable:
Dependent variable:Create a graph that can help you directly test the question posed and paste below:
Interpret the Data:
4. Make a claim that answers the scientific question.
5. What evidence was used to write your claim? Reference specific parts of the tables or graph.
6. Explain your reasoning and why the evidence supports your claim. Connect the data back to what you learned about how different groups of zooplankton change during El Niño events.
7. Did the data support Laura’s hypothesis? Use evidence to explain why or why not. If you feel the data were inconclusive, explain why.
Your next steps as a scientist:
8. Science is an ongoing process. What new question do you think should be investigated? What future data should be collected to answer your question?

These questions are a digital extension of the original Data Nuggets activity. The data manipulation and graphing tasks within are best completed here on DataClassroom.
One way in which you can test the above hypothesis is to compare the dependent variables directly between the presence or absence of an El Nino event. Paste a graph below that shows this relationship with descriptive statistics such as mean and 95% CIs.


2. Conduct the appropriate statistical analysis to test if each of these relationships are significant. Indicate the tests against the dependent variable and paste the results below
3. Explain the patterns you observe by including evidence for those claims from appropriate tests. Does this support the hypothesis proposed?
4. Since Laura’s hypothesis rested on the assumption that the abundance of zooplanktons is tightly related to the abundance of phytoplanktons, paste a graph below which allows you to directly test this assumption for each type of zooplankton with the appropriate regression line


5. Describe what you observe in the patterns above and how this may explain your findings regarding the impact of El Nino events on the biomass of planktons.
Want an Answer Key? Fill out the form below.
This dataset and content is provided our by our friends at Data Nuggets.
Visit DataNuggets.org to see the original activity and additional materials
