Are the males bigger than the females?
A DataClassroom simulation activity
Sample a simulated lizard population to explore using a t-test to compare two groups in terms of a numeric variable. Use the simulation to explore the role of sample size and random variation in detecting a modest statistical effect.

Background
Adult brown anole lizards show pronounced sex differences. The body length of adult males is about 30% greater than it is for females. However, as hatchlings these outward sex differences are not nearly as pronounced and there is much overlap in the body length of juvenile males and females when looking at a sample of measurements taken from a lizard population. Using such a sample we can ask the question of whether or not the average juvenile male is larger than the average juvenile female.
With a sample of both juvenile males and juvenile females we can use a t-test to test for a significant difference between the body length of the two groups. The t-test assumes that our samples are taken at random from the population, that the data for each group follow a normal distribution, and that the standard deviations of the two groups are roughly the same. The t-test, like all statistical tests, is a way of assessing the probability of obtaining results like the ones that you collected if in fact the null hypothesis is true (i.e. there is no difference in body length between the sexes of juvenile lizards). Remember that a statistical test is just a tool for evaluating the evidence you have in a given dataset. It is not designed or intended to produce a definitive yes or no answer.
In this activity, you and your classmates will use the simulation tool to each independently take samples of relatively small and large sizes. You will make comparisons between both your own small and large samples as well as with the data your classmates collect.
Variables
Sex - This categorical variable has the value of either Male or Female. In actual studies with this species, this is determined by examining the post-anal scales.
Body Length (mm) - This numeric variable is the length of a lizard from the tip of the snout to the cloacal opening. This is the length of the lizard, not including the tail, measured to the nearest millimeter
Activity
In this activity you will repeatedly sample the simulated population twice, once with a relatively small sample (20 samples) and once with a larger sample (1000 samples)
Use the Generate #samples field to get the desired number of samples for each simulation run (a). Press the green Play button to start each run of the simulator (b). Hover on the information icon to see the mean for any given run (c).
You will also go on to take these simulated datasets into the DataClassroom tool with the Create dataset button (d).
You will complete Part I. of this activity in the simulation tool. You will create two simulated datasets and then complete Part II. within the datasets that you create.

Part I.


Run a simulation with a sample size of 20 lizards.
This will become your Run 1. What are the means for Females and Males in this first sample of 20 lizards?
Run a simulation with a sample size of 1000 lizards.
This will become your Run 2. What are the means for Females and Males in this sample of 1000 lizards?
These two simulations, Run 1 with n = 20 and Run 2 with n = 1000 were sampled from the same population. What explains the difference in the sample mean for each sex between the two runs? Which means do you think are closer to the true population mean that has been set in the simulation model? Why?
Create a dataset for each of your two simulation runs.
You can do this by selecting the Create dataset button in the upper right and choosing the > From this run option in the dropdown (d). You will need to do this for each run. Open both datasets in new tabs so you can easily navigate between them.
Part II.
Use the two datasets you created in Part I to conduct analysis. Work with your classmates to make a class dataset and draw conclusions about the class data.
Individual work
5. For each of the two datasets you created in #4 (for Run 1 and Run 2), graph the data using a dot plot that also shows the mean and 95% confidence intervals as error bars.
6. Just looking at the graphs you created and thinking about the question of “Are the males bigger than the females?” What is the conclusion that you would draw for from each dataset independently (Run 1 and Run 2)?
7. Now conduct a t-test (using the Graph Driven Test) for each dataset to test for a statistically significant difference in body length between males and females. Remember that typically P values of less than 0.05 would lead you to reject the null hypothesis (i.e. no difference in body length between the sexes). Record your results below.
Run 1 (n = 20)
P value:
Interpretation based on this test:
Run 2 (n = 1000)
P value:
Interpretation based on this test:
*If you want a demonstration of how the math behind the t-test actually works, feel free to run your t-test with the Interactive Analysis.
8. Did you reach the same conclusion with the t-test for both datasets? Why do you think you did or did not reach the same conclusion with both tests? Remember that you conducted random sampling from the same population to create both these datasets.
Collaborative classwork
9. Make a class dataset to record the P-values from the t-tests conducted by you and your classmates. Each row in the dataset should be a single t-test run for a different dataset. Each student will contribute two rows of data, one for their small dataset (n = 20) and one for their large dataset (n = 1000). Your class dataset should look like this, but longer:
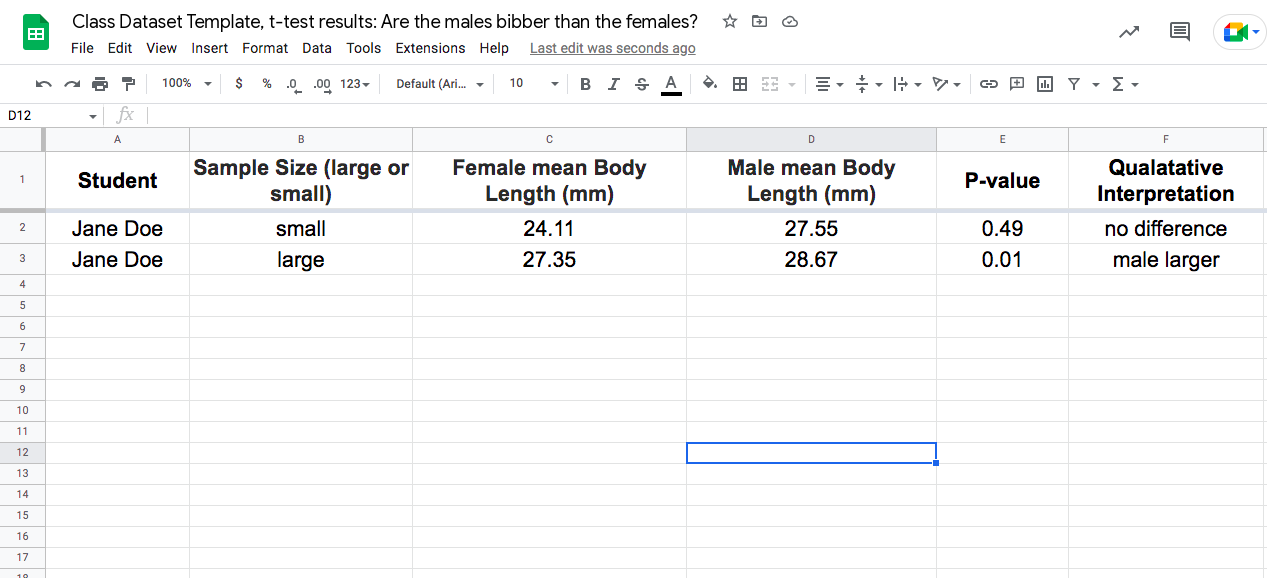
Your teacher can make a copy of this Google Sheet and all use the same Google Sheet if your class would like to collect your class data there.
Note that the variable called Sample Size should be recorded as a categorical variable with the values of large (n = 1000) or small (n = 20).
The variable called Qualitative Interpretation is a categorical variable with the values of no difference (P > 0.05), male larger (larger male mean with P < 0.05) and female larger (larger female mean with P < 0.05).
*record any values of < 0.01 as 0.01 to keep non-numeric characters out of your numeric data
10. Looking at the class data for just the observations of the small sample size runs, what percentage of the time did you obtain a result where the qualitative interpretation was male larger?
11. Looking at the class data for just the observations of the large sample size runs, what percentage of the time did you obtain a result where the qualitative interpretation was male larger?
12. Considering that all runs were sampled from the same population what accounts for the differences in your answers to question #s 10 and 11?
13. Do you think a researcher who wants to know if juvenile lizards of different sexes differ in their body size is better off conducting many small studies or just one large study? Use the class data as evidence.
14. A type I error (false-positive) occurs if we reject a null hypothesis that is actually true in the population; a type II error (false-negative) occurs if we fail to reject a null hypothesis that is actually false in the population. Which type of error did we see occurring most often in the class data? What conditions seemed to make this type of error more likely?