CSI: Crime Solving Insects

This dataset and content is provided our by our friends at Data Nuggets. Visit DataNuggets.org to see the original activity and additional materials
Featured scientists: Kristi Bugajski (she/her) and Parker Stoller (he/him) from Valparaiso University
Background:
Most people think that maggots are gross, but they are important decomposers in many ecosystems. Without maggots and other decomposers, we would all trip over the bodies of dead organisms every time we went outside! Not only do maggots break down dead animal bodies in nature, but they also decompose human bodies!
Forensic entomology is a science that uses these amazing insects to help the criminal justice system. Maggots are the larvae of blow flies. Remember the next time you swat away a fly, these little insects help police solve crimes! Adult blow flies are usually the first to arrive at a crime scene with a dead body. The blow flies lay their eggs, or oviposit, shortly after their arrival. These eggs hatch and become maggots that feed on the body. Scientists can use the age of the maggot to help estimate how long someone has been dead. The longer a body has been dead, the longer ago the eggs hatched and the older the maggot larvae will be.

Parker in the field using an insect net to catch blow flies.
Kristi and Parker, two forensic entomologists, were in the field one day, documenting the timing of blow fly oviposition. They noticed something unexpected! There were wasps stuck in the traps they were using to catch blow flies. The scientists wondered if these wasps could affect a blow fly’s decision to oviposit because wasps attack adult blow flies and also eat their eggs. Kristi and Parker knew that blow flies have an incredible sense of smell and sight. They wondered if blow flies are able to use their senses to detect if a wasp is near a body and then choose to avoid the area or delay laying their eggs. The scientists predicted that blow flies should delay their oviposition when wasps were present near a body. If wasps indeed cause blow flies to delay oviposition, this could change how scientist’s use maggot age to determine how long ago a body died.

One of thirty control bait cups with a large number of blow flies on the chicken liver.
To test their idea, the scientists did 10 trials in the field. They used bait cups that contained chicken liver to simulate a dead human body. A total of 9 bait cups were used in each of the 10 trials, for a total of 90 cups. Of the 9 cups used in each trial, three contained only chicken liver, to represent a body with no wasps present. These cups were used as controls. Three cups contained chicken liver and a wasp pinned to the side of the bait cup so that there was a visual cue of the wasp. The final three cups had a crushed wasp sprinkled over chicken liver to see if blow flies could use a smell cue to tell that a wasp was present without seeing them. Kristi and Parker checked the cups every half hour for the presence of blow fly eggs. If they saw any eggs, they recorded the time of oviposition in hours after sunrise. They then brought the maggots to the lab and raised them to the third larval stage and identified them to species.
Scientific Question: What effect does the presence of a wasp have on blow fly oviposition? Do blow flies use either smell or visual clues to detect wasps?
Scientific Data:
Find the hypothesis in the Research Background and and copy/paste it below. A hypothesis is a proposed explanation for an observation, which can then be tested with experimentation or other types of studies.
Click on the graph tab, and explore the available variables. What data will you graph to explore the first hypothesis? Independent variable:
Dependent variable:Create your graph, and add Collection Data Type to your z-axis. Paste your graph below:

4. To find the mean of the data, add descriptive stats, select SEM, and paste it below:

5. Identify any changes, trends, or differences you see in your graph. Write one sentence describing what you see.
Interpret the Data:
6. Make a claim that answers the scientific question.
7. What evidence was used to write your claim? Reference specific parts of the tables or graph.
8. Explain your reasoning and why the evidence supports your claim. Connect the data back to what you learned about blow flies’ sense of smell and sight.
9. Did the data support Kristi and Parker’s hypothesis? Use evidence to explain why or why not. If you feel the data were inconclusive, explain why.
Your next steps as a scientist:
10. Science is an ongoing process. What new question(s) should be investigated next to build on Kristi and Parker’s research? What future data should be collected to answer your question(s)?

These questions are a digital extension of the original Data Nuggets activity. The data manipulation and graphing tasks within are best completed here on DataClassroom.
11. Typically, scientists make use of statistical analysis to determine that any difference between two values is reflective of natural phenomena regardless of the population being surveyed. Go to the Graph Driven Tests located at the upper right corner of your screen and list 2-3 reasons why an ANOVA is the most appropriate to test if the pattern in Q3 is significant or not.
12. What is your conclusion? How would you interpret the P - value obtained with this dataset? Paste results from the analysis here.
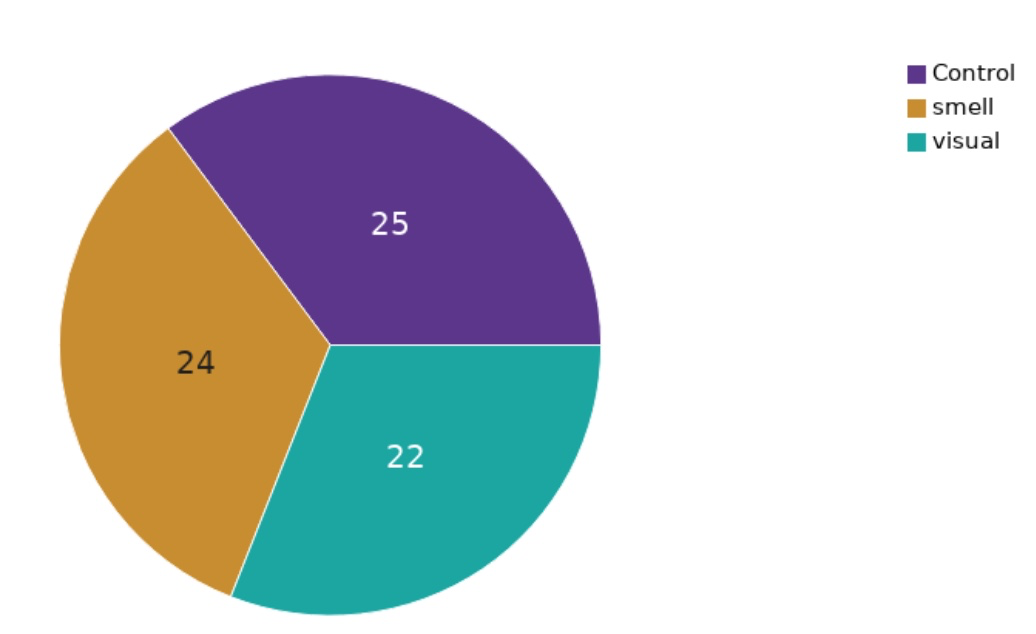
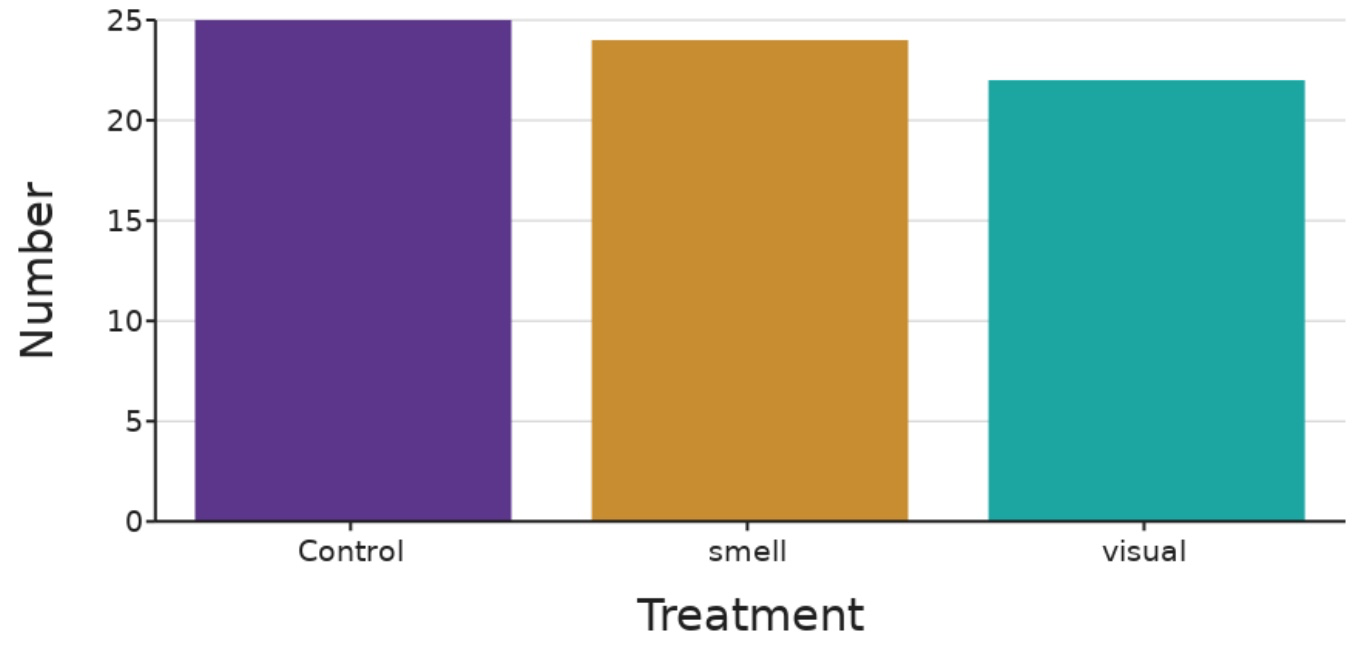
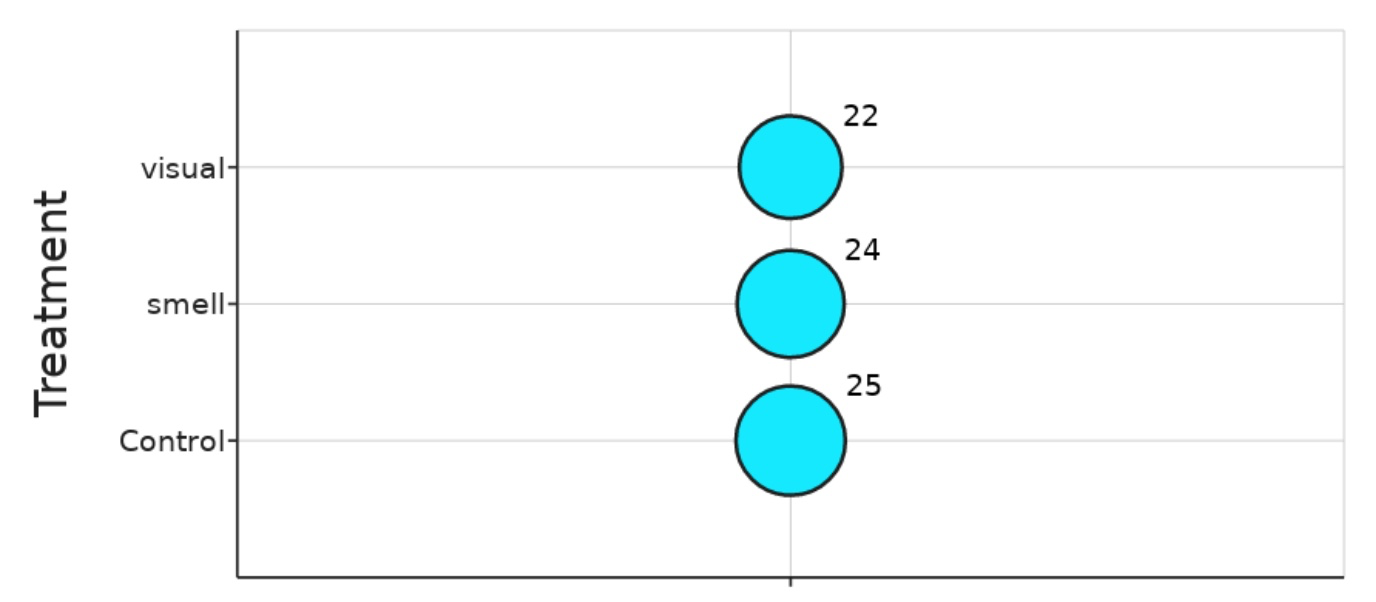
13. Another way in which Kristin and Parker could have tested for the effect of predation on the propensity of blow flies to oviposit was to investigate the difference in the total number of eggs across the different treatment groups. Paste your graph below indicating the total number of eggs detected in each treatment group, describe what you find and if it matches your expectation.
14. In Q3, we expected flies to delay oviposition, such that the mean time for ovipositing may be higher in the control groups compared to the treatment groups. Another way to visualize this relationship may be to test the correlation between number of eggs laid at a given time point and testing if it is a positive relationship in case of the predator cue groups while being negative or unrelated in the control group. Paste a graph below that demonstrates this relationship along with the parameters describing the line of best fit. Do you find support for this relationship?


Want an Answer Key? Fill out the form below.
This dataset and content is provided our by our friends at Data Nuggets.
Visit DataNuggets.org to see the original activity and additional materials
