Catch of the Data
How have local seafood consumption recommendations changed over time at locations near an EPA Superfund site?


Background:
Glynn County, Georgia has four EPA Superfund sites—places with serious pollution that need long-term cleanup. Because these sites are close together, Brunswick (the nearby town) faces a difficult environmental challenge.
Like many coastal towns, Brunswick has a strong fishing culture. People have eaten local fish and shellfish for generations. But as pollutants entered the soil and waterways, the marine food chain began to show higher levels of mercury and PCBs (polychlorinated biphenyls).
To protect public health, the Georgia Department of Natural Resources (GDNR) tests fish around the state and publishes seafood consumption recommendations. These recommendations explain how often it is safe to eat certain species from specific locations. They are based on scientific testing of pollutant levels in fish tissue, and they can change as scientists learn more or as cleanup efforts make a difference.
In the mid-1990s, after Glynn County sites were added to the Superfund list, the GDNR issued strict advisories for local seafood—often listed as “Do Not Eat.” The dataset you’ll explore shows how guidance for Brunswick has changed over time at three different locations as cleanup has progressed and time has passed. Your task is to look for patterns in the seafood-consumption recommendations for sites in the Turtle River Estuary and decide which parts of the story change as you filter the data in different ways.
Why filtering data is useful:
Real-world datasets often include more information than you need. Data scientists often use filters to focus on the most useful pieces. Good filtering:
helps you see the main story more clearly
saves time and computing power
reduces the chance you’ll be distracted by extra details.
What you’ll do:
In this activity, you will:
Use filters to focus on Brunswick-area species, sizes, and locations.
Make graphs to show how seafood recommendations have changed over time.
Explain what the trends suggest about cleanup efforts and seafood safety.
Note: For real-life food decisions, always check the most current guidance from the GDNR. This activity uses historical data for educational purposes only.
Dataset
These data were collected from publications titled “Guidelines for Eating Fish from Georgia Waters” produced by the Georgia Department of Natural Resources Environmental Protection Division and Wildlife Resources Division. We sourced data from three years which cover the start of this data collection and recommendations (1997), the most recent data collection (2023), and a year in the middle (2010).
Recommendations are determined based on fish tissue sampling. From the report: “Standard collections for fish consumption guidelines (FCG) are comprised of 3 composites of each species, where each composite contains 5 individual fish of that species. A sample size of fifteen fish has been found necessary to obtain a representative contaminant level to account for natural variations within a population. Composite sample analysis allows us to assess this number of fish and minimize the laboratory analytical support costs.” (You can read more here)
To see the full list of publications per year, visit the Digital Library of Georgia.
Variables
Location - this categorical variable groups the location of fish sampling into waterways through and surrounding Brunswick, GA. Values include Purvis and Gibson Creek, Middle Turtle River, Lower Turtle and South Brunswick Rivers.
Year - This categorical variable lists the year of publication for the consumption advisory. Values include 1996, 2010, and 2023
Seafood Species - This categorical variable indicates the species for which the consumption recommendation is surveyed. Values include Black Drum, Blue Crab, Red Drum, Shrimp, and Spotted Seatrout.
Consumption Recommendation - This categorical variable describes the recommendation for how much of the seafood type should be consumed at what rate. Values include Do Not Eat, 1 meal / month, 1 meal / week, No Restriction.
PCB - This categorical variable denotes if Polychlorinated Biphenyls (PCB’s) are found in the fish tissue sample. Values include Yes or No.
Mercury - This categorical variable denotes if mercury is present in the fish tissue sample. Values include Yes or No.
Activity
Part 1: Compare locations for each year
1.Make a graph of Location as your x-variable and Consumption Recommendation as your z-variable.
Screenshot and paste your graph below:
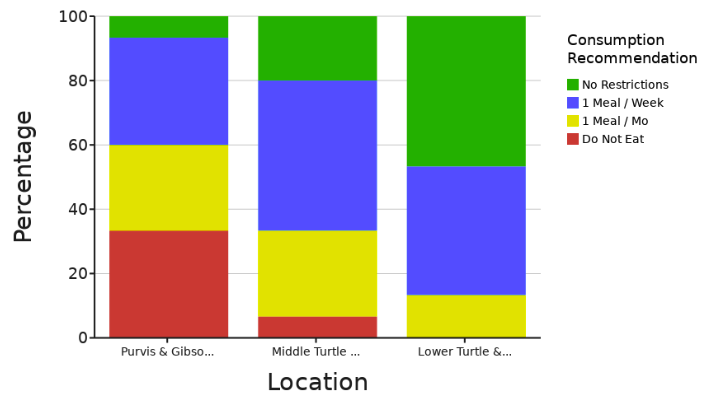
2. What does this graph tell you about the relative safety of the seafood in each of these locations when you compare the locations to each other?
3. The graph above includes all of the data from the years 1996, 2010, and 2023. This makes it impossible to see the data story for any one single year of data in the dataset. To see the seafood consumption recommendations for one specific year, let’s filter the dataset!
Exclude data for all years except 1996.
Screenshot and paste your new graph below to show the recommendations for consumption for 1996:
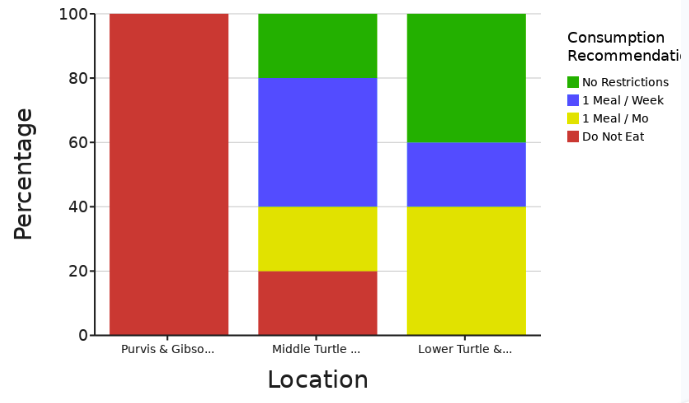
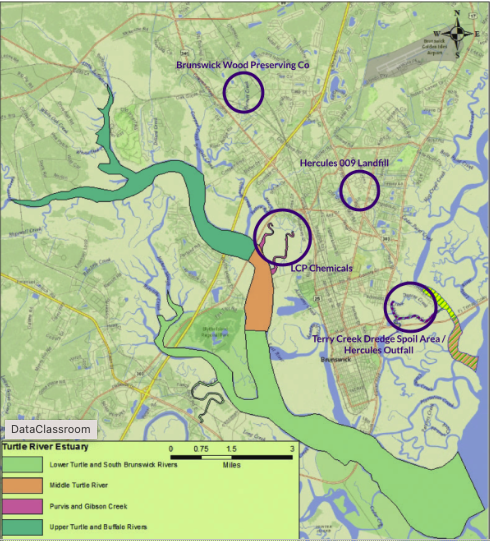
4. Here is a map of the area with the four Superfund sites circled in purple.
Looking at the data in the graph above, how might the location of the Superfund Sites explain the differences in seafood consumption recommendations that you see for the three different Locations represented in the dataset?
5. Now change your filtering (using Exclude once again) to show only the year 2023. Screenshot and paste your graph below:
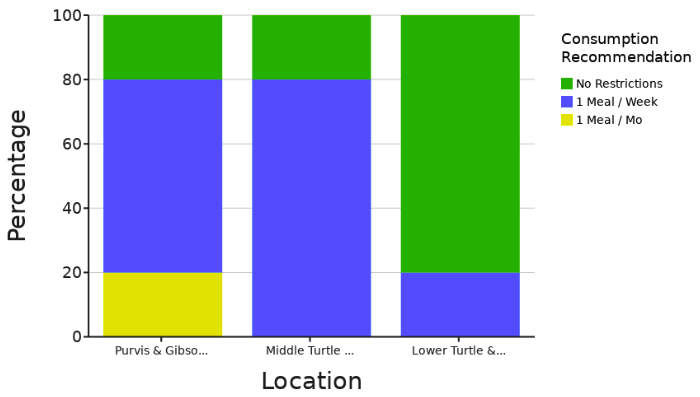
6. How has the overall picture of the consumption recommendations changed over time in each of the three locations?
Part 2: Make Predictions
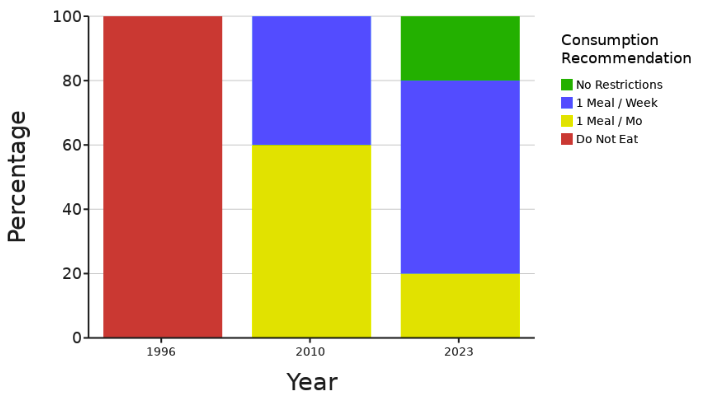
7. First, remove your filters for all the years (so all data are included). Now, let us look only at the location nearest the Superfund Sites: Purvis and Gibson Creek by excluding the other two Locations.
Set Year as your x-variable, and Consumption Recommendation as the z-variable. Screenshot and paste your graph below:
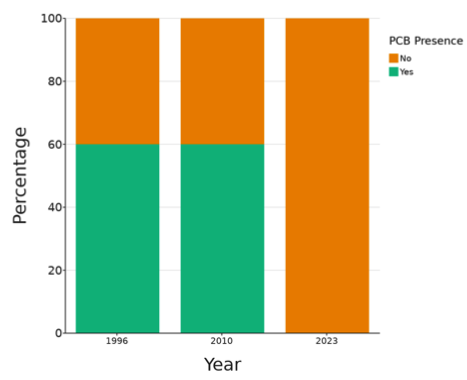
8. Set PCB Presence as the z-variable (legend variable). Screenshot and paste your graph below.

9. How does PCB presence in seafood change over time in Pervis Creek?
10. Make another graph, selecting Mercury Presence as the z-variable. Screenshot and paste your graph below.

11. Which of the two contaminants (PCB & Mercury) seem to be improving the most over time?
Part 3: Test your predictions with the data
Explore specific contaminates at the location furthest from the Superfund sites.
12. Change your filter (using the exclude feature) to look at the location furthest downstream of the Superfund Sites: Lower Turtle & South Brunswick River. Set PCB as the z-variable.
Screenshot and paste your graph below:
13. How has PCB Presence changed over time at the Lower Turtle Location?
14. Change your z-variable to Mercury. Screenshot and paste your graph below:

15. Looking at both locations, which contaminant seems to have responded best to either time or the restoration efforts?
Part 4: Draw big picture conclusions
16. Based on the data you have seen in this activity. What do you think the data show about the effectiveness of the cleanup efforts at the superfund sites near Brunswick, Georgia since 1996?
Refer to specific examples in the data as evidence for your opinion here.