Bringing Back the Trumpeter Swan

*This is a modified version of the original Data Nugget that has been designed to be used on the DataClassroom web-app. The original pencil and paper activity can be found here on the Data Nuggets website
Featured scientist: Wilbur C. “Joe” Johnson from the W.K. Kellogg Bird Sanctuary
Written by: Lisa Vormwald and Susan Magnoli
Background
The Kellogg Bird Sanctuary was created in 1927 to provide safe nesting areas for waterfowl such as ducks, geese, and swans. During that time many waterfowl species were in trouble due to overhunting and the loss of wetland habitats. One species whose populations had declined a lot was the Trumpeter Swan. Trumpeter swans are the biggest native waterfowl species in North America. At one time they were found across North America, but by 1935 there were only 69 known individuals in the continental U.S.! The swans were no longer found in Michigan.

The reintroduction, or release of a species into an area where they no longer occur, is an important tool in helping them recover. In the 1980s, many biologists came together to create a Trumpeter Swan reintroduction plan. Trumpeter Swans in North America can be broken up into three populations – Pacific Coast, Rocky Mountain, and Interior (see map on the following page). The Interior is further broken down into Mississippi/Atlantic and High Plains subpopulations. Joe, the Kellogg Bird Sanctuary manager and chief biologist, wrote and carried out a reintroduction plan for Michigan. Michigan is part of the Mississippi/Atlantic subpopulation. Joe and a team of biologists flew to Alaska in 1989 to collect swan eggs to be reared at the sanctuary. After two years the swans were released throughout Michigan.
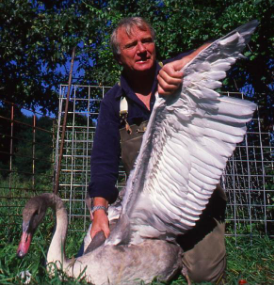
Image right: Joe with a Trumpeter Swan.
The North American Trumpeter Swan survey has been conducted approximately every 5 years since 1968 as a way to estimate the number of swans throughout their breeding range. The survey is conducted in late summer when young swans can’t yet fly but are large enough to count. Although the surveys are conducted across North America, the data below focuses on just the Interior Population, which includes swans in the High Plains and Mississippi/Atlantic Flyways.
Scientific Question: What were the effects of the reintroduction plan on the number of swans in the Interior Population?
Scientific Data:
1. Click on the graph tab, and explore the available variables. What data will you graph to answer the scientific question:
Independent variable (s):
Dependent variable (s):
2. Create your graph(s) and screenshot them below:

3. Identify any changes, trends, or differences you see in your graph. Include your graph and specifically refer to it when describing those changes, trends, or differences.
Interpret the Data:
4. Make a claim that answers the scientific question.
5. What evidence was used to write your claim? Reference specific parts of the tables or graph.
6. Explain your reasoning and why the evidence supports your claim. Connect the data back to what you learned about swan reintroduction efforts in North America and Michigan specifically.
Your next steps as a scientist:
7. Science is an ongoing process. What new question(s) should be investigated to build on Joe’s research? How do your questions build on the research that has already been done?
Want an Answer Key? Fill out the form below.
This dataset and content is provided our by our friends at Data Nuggets.
Visit DataNuggets.org to see the original activity and additional materials
