Epidemic in a pandemic
What effect did COVID-19 have on the opioid crisis in the US?

Background
The spread of the COVID-19 pandemic in the United States has pushed public health issues to the forefront of the national dialogue in the US like never before. As millions of Americans have contracted COVID-19 and hundreds of thousands have succumbed to the virus, the first line of defense to slow the spread of the virus and save lives has been social distancing measures. Unfortunately, such measures have presented very specific challenges in fighting the ongoing opioid epidemic.

From the very beginning of the pandemic, public health experts feared that because addiction treatment is largely done face to face, measures that would be effective against COVID-19 may reduce access to treatment providers specializing in addiction medicine. In addition to the very tangible issue of reduced access to treatment during the pandemic, addiction experts also worried that feelings of isolation and despair brought on by less social contact at a time when so many aspects of life have been upended could have a devastating effect on those struggling with addiction. This is all happening at a time when the synthetic opioid fentanyl, a more powerful and more deadly opioid, continues to replace heroin in the illicit drug trade.
To assess whether or not these fears were being realized, public health experts began looking to the data for answers just after social distancing measures were put in place around the United States in March of 2020. Since that time, more than 40 states have already reported year over year increases in opioid overdose deaths in their preliminary data for 2020. One of the early peer-reviewed studies in 2020 to provide data on the effects that COVID-19 may be having on the opioid epidemic was conducted by researchers at the University of Kentucky and is featured in the data activity below.
Articles describing the effect of the COVID19 pandemic on the opioid epidemic:
Kamp, Jon. “Coronavirus Pandemic Complicates Opioid Treatment.” The Wall Street Journal, Dow Jones & Company, 7 Apr. 2020.
In this interview, Megan Moncur, FDA’s Associate Director of Opioid Policy, discusses the opioid epidemic and how it’s been impacted by the COVID-19 pandemic.
Dataset
This dataset comes from the Kentucky State Ambulance Reporting System and was collected from emergency response records for opioid overdose records throughout the entire state from January 14, 2020 to April 26, 2020. The researchers used a computer algorithm to identify EMS calls for opioid overdoses from the records based on field enteries recorded by emergency medical technicians, naloxone administration, and a positive response to naloxone. Although the original study conducted analysis using all EMS calls for opioid overdoses, in this activity you will be working with a subset of that data. This activity is focused strictly on EMS calls where opioid overdose patients were treated on the scene but refused transport to the hospital. These data can be particularly valuable because as the researchers note in their study, it allows us to analyze “opioid overdose encounters that are not captured by the emergency department claims data.

Variables
Date: The recorded date for each observation (number of EMS runs with refusal). This variable has been coded as Info and cannot be used in graphing in DataClassroom. The variable called “t” can be used for graphing purposes.
t (day number): This numerical variable represents the day number of the study when each observation was recorded. The first day of the study (January 14, 2020) is represented as 1, while the final day of the study is represented as 104 (April 26, 2020).
Daily EMS Runs with Refusal: This numeric variable is the number of EMS runs for opioid overdose calls on a single day, where patients were treated on the scene, but refused transport to the hospital. There are many reasons why an opioid overdose patient may refuse transport to the hospital. Such reasons pointed out by the researchers in this study include fear of law enforcement, cost, fear of experiencing withdrawal, and the fear of exposure to COVID-19 at the hospital.
Before/After March 20, 2020: This categorical variable indicates whether a daily observation took place before or after March 20, 2020. This change point was mathematically identified by the researchers conducting the study by comparing many different statistical models and choosing the model that best fit the change in slope and Y-intercept. This March 20 date is two weeks following the state of emergency declaration for COVID-19 and roughly one week after social distancing measures began to be widely adopted.
Activity

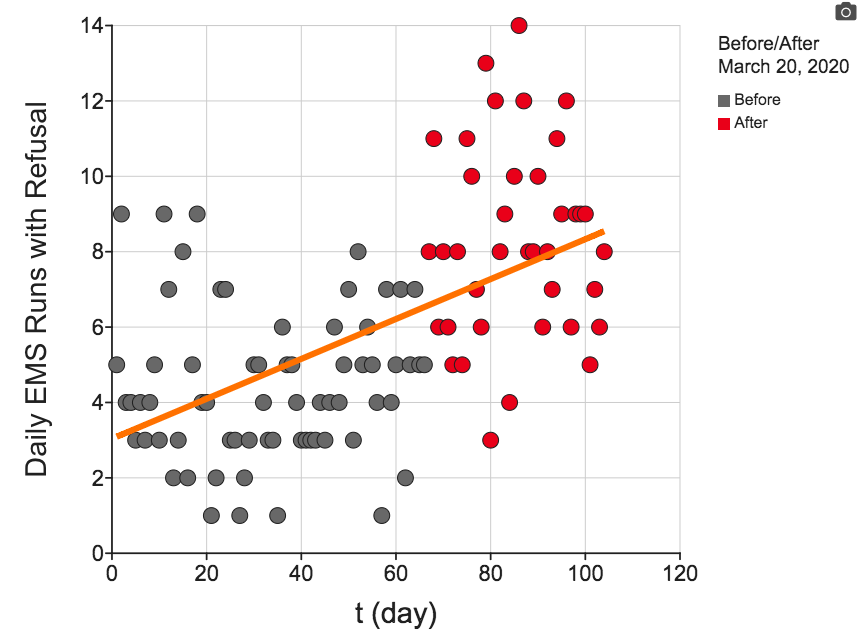
1. Make a graph showing Daily EMS Runs with Refusal on the Y-axis and t (day number) on the X-axis. To do this, make sure you are using the scatter plot graph type. Click the Regression line box to the right of the graph to show the apparent relationship between the X and Y variables.
What is the apparent relationship between the number of daily EMS runs for opioid overdoses and time over the course of the study?
2. Look at how the line of best fit predicts the number of EMS runs for a given day while considering which datapoints were collected after social distancing had been widely adopted.
To aid in this view, Show the variable called Before/After March 20, 2020. Click the Z button to the right of the graph to color code the date by Before/After.
Note that the COVID-19 emergency declaration was on March 6th (day number 53) and that March 20th (day number 67) was the mathematically determined change point in the data that was identified by the researchers.
What do you notice visually about the pattern in the data when you can clearly see the data points before and after the March 20 change point?
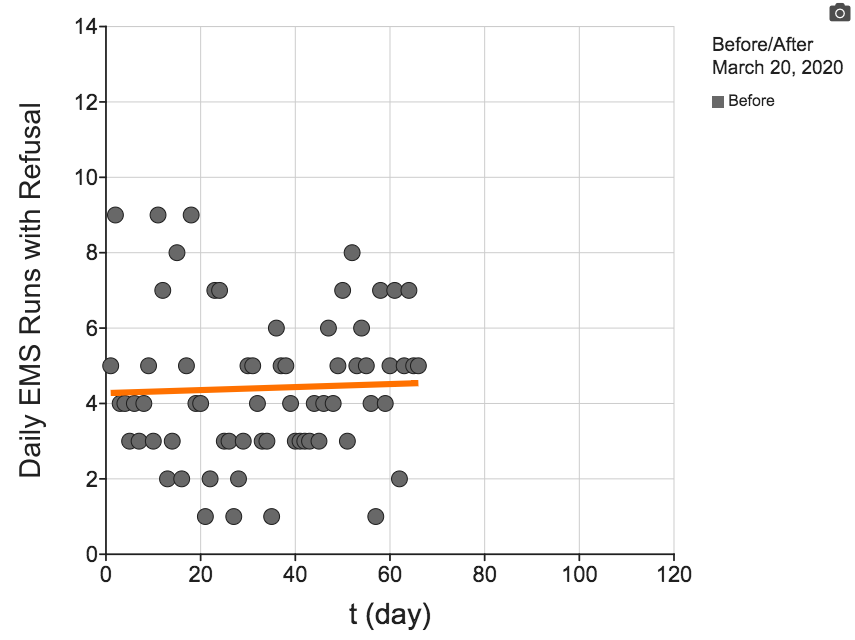
3. Now visualize the data and the linear regression for just the Before period of time.
To do this, go to the variable listing for Before/After March 20, 2020 above the graph and click on the Values button. First check the Exclude box for the After values to visualize the data without the points for after March 20.
How does the slope of the relationship change when you consider just the data points from the Before time period?
4. Now visualize the data and the linear regression for just the After period of time.
To do this, go to the variable listing for Before/After March 20, 2020 above the graph and click on the Values button. First check the Exclude box for the Before values to visualize the data without the points for before March 20.
What is the relationship between the number of daily EMS runs for opioid overdose and the day number when you consider just the datapoints from the After period of time?

Considering what you saw with this graph and the previous graph in question #3, do you think it is a better model of reality to use a single line of best fit across the entire study period, or do you think it is more appropriate to model the time periods immediately before and after the COVID-19 emergency declaration using two different lines of best fit? Explain your answer by referring to your graphs.
5. The same data can often be viewed in multiple ways. Try making a dot plot to more directly compare the daily number of EMS runs for opioid overdoses for the before and after periods.
To do this, first undo the Exclude that you used in question number 4. Then show Before/After March 20, 2020 on the X-axis and Daily EMS Runs with Refusal on the Y-axis. You can use the X and Y buttons to the right of the graph to do this. Try adding Descriptive stats with the check box.
How does the mean number of Daily EMS Runs with Refusal change in the period shortly after COVID-19 social distancing measures became adopted in Kentucky?

6. The researchers who conducted this study wrote that “Effective public health response to the opioid epidemic, especially during a COVID-19 pandemic, depends on timely and accurate data to inform data-driven decisions.” Based on the dataset you worked with here, what do you think might be necessary steps that the public health system could take to deal with the opioid crisis during the COVID-19 pandemic?
Statistics Extension
*If your school does not yet have a DataClassroom license, you will need to start a free trial and create classes to begin a 90-day free trial of premium features, including the Graph Driven Hypothesis Test used in this statistics extension.
7. Is there a statistically significant relationship between t (day number) and Daily EMS Runs with Refusal?
Use a linear regression to test this and include a P-value in your answer.

To test for the relationship between t (day number) and Daily EMS Runs with Refusal, recreate the graph you made in question number 1 above. While viewing in the graph maker, click on the Graph Driven Test button on the right-hand panel (beside the Appearance button).
8. In just the period of time After March 20, 2020 is there a statistically significant relationship between t (day number) and Daily EMS Runs with Refusal?
Use a linear regression to test this and include a P-value in your answer.
As you did in #4, visualize the data and the linear regression for just the After period of time by excluding the data with Before as the value of the Before/After March 20, 2020 variable. Then click on the Graph Driven Test button on the right-hand panel.
9. Based on your answer to #8, do you think the linear regression is a good model for describing the increase in Daily EMS Runs with Refusal that happened around the time of the emergency declaration for COVID19 in Kentucky? Explain why or why not.
Additional resources for your classroom:
For more about the dangers of opioids, there are a number of resources to access, including this quick explanation from drugabuse.gov:
The Body’s Response to Opioids
The history and science behind opioids from TED-Ed.
Confidential, free help from public health agencies is available 24/7/365 via the Substance Abuse and Mental Health Services Administration National Helpline as 1-800-662-4357. Additionally, the SAMHSA website can help locate local treatment resources.
Training and information about naloxone for bystanders is available at Get Naloxone Now.
Original Study presenting data used in this activity.
VOX: “The stakes are life and death”: Addiction treatment’s Covid-19 challenge