Dangerously Bold

*This is a modified version of the original Data Nugget that has been designed to be used on the DataClassroom web-app. The original pencil and paper activity can be found here on the Data Nuggets website.
Featured scientist: Melissa Kjelvik from Michigan State University
Background
Just as each person has her or his own personality, animals behave very differently from one another even if the same species! For example, pets, like dogs, have different personalities. Some have a lot of energy, some are cuddly, and some like to be alone. Boldness is a behavior that describes whether or not an individual takes risks. Bold individuals take risks while shy individuals do not. The risks animals take have a big impact on their survival and the habitats they choose to search for food.
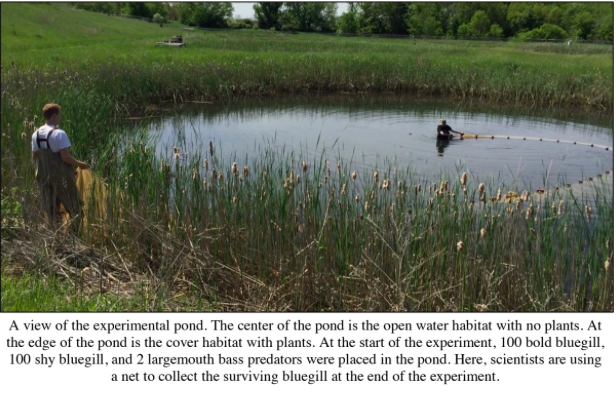
Bluegill sunfish are a type of fish that lives in freshwater lakes and ponds across the world. Open water and cover are two habitat types where young bluegill are found. The open water habitat in the center of the pond is the best place for bluegill to eat a lot of food. However, the open water is risky and has very few plants or other places to hide. Predators, like large birds, can easily find and eat bluegill in the open water. The cover habitat at the edge of the pond has many plants and places to hide from predators, but it has less food that is best for bluegill to grow fast. Both habitats have costs and benefits—called a tradeoff.
Melissa is a scientist who is interested in whether differences in young bluegill behavior changes the habitats in which they choose to search for food. First, she looked at whether young bluegill have different personalities by bringing them into an aquarium lab and watching their behavior. Melissa observed that, just like in humans and dogs, bluegill sunfish have different personalities. She noticed that some bluegill took more risks and were bolder than others. Melissa wanted to know if these differences in behavior could also be observed in her experimental pond. She reasoned that being in open water is risky, but results in more access to food. Therefore, bold fish should take more risks and use the open water habitat more than shy fish, giving them more food, allowing them to grow faster and larger, but exposing them to more predation. Just the opposite should be true about shy fish: more time for them in the cover habitat of the pond exposing them to less predation, but also giving them less access to food and an overall smaller body size than bold fish. A tradeoff for both types of fish based on personality.
Melissa designed a study to test the growth and survival of bold and shy fish. When she was watching the fish’s behavior in the lab, she determined if a fish was bold or shy. If a fish took the risk of leaving the safety of the vegetation in a tank so that it could eat food while there was a predator behind a mesh screen, it was called bold. If it did not eat, it was called shy. She marked each fish by clipping the right fin if it was bold or the left fin if it was shy. She placed 100 bold and 100 shy bluegill into an experimental pond with two largemouth bass (predators). The shy and bold fish started the experiment at similar lengths and weights. After two months, she drained the pond and found every bluegill that survived. She recorded whether each fish that survived was bold or shy and measured their growth (length and weight).
Note: In the data table, if weight or length is missing for a fish, it is because the fish died and change in weight or length could not be recorded.
Scientific Questions: How does the boldness of bluegill affect their survival and growth? Is there a tradeoff in bold and shy behaviors?
Scientific Data:
Find the hypothesis in the Research Background and copy/paste it here. A hypothesis is a proposed explanation for an observation, which can then be tested with experimentation or other types of studies.
Visualize your predictions:
2. Double click on the image below to modify it and answer the questions:

What data will you graph to answer the questions?
Graph 1: Survival
3. Identify the variables for this graph:
Independent variable:
Dependent variable:
4. Make a graph using your selected variables, and paste it below: Note: this graph is a bit different than usual - you will be able to select your x-axis variable (independent) and your z-axis variable (fate). Y-axis will be your count or how many!

5. Write one sentence describing what you see as trends in the data.
Graph 2: Length
6. Identify the variables for this graph:
Independent variable:
Dependent variable:
7. Make a graph using your selected variables, and paste it below:


8. To find the mean of the data, add descriptive stats, select SEM, and paste it below:

9. Write one sentence describing what you see as trends in the data.
Graph 3: Weight
10. Identify the variables for this graph:
Independent variable:
Dependent variable:
11. Make a graph using your selected variables, and screenshot it below:

12. To find the mean of the data, add descriptive stats and select SEM. Screenshot your graph below:

13. Write one sentence describing what you see as trends in the data.
Interpret the Data:
14. Make a claim that answers the scientific question.
15. What evidence was used to write your claim? Reference specific parts of the tables or graph.
16. Explain your reasoning and why the evidence supports your claim. Connect the data back to what you learned about the effects of flood disturbances on stream habitats.
17. Did the data support Melissa’s hypothesis? Use evidence to explain why or why not. If you feel the data were inconclusive, explain why.
Your next steps as a scientist:
18. Science is an ongoing process. What new question(s) should be investigated to build on Melissa’s research? What future data should be collected to answer your question(s)?
Want an Answer Key? Fill out the form below.
This dataset and content is provided our by our friends at Data Nuggets.
Visit DataNuggets.org to see the original activity and additional materials
