City parks: wildlife islands in a sea of cement

This dataset and content is provided our by our friends at Data Nuggets. Visit DataNuggets.org to see the original activity and additional materials
Featured scientists: Remington Moll and Grant Woodard from Michigan State University
Background:
For most of our existence, humans have lived in rural, natural places. However, more and more people continue to move into cities and urban areas. The year 2008 marked the first time ever in human history that the majority of people on the planet lived in cities. The movement of humans from rural areas to cities has two important effects. First, the demand that people place on the environment is becoming very intense in certain spots. Second, for many people, the city is becoming the main place where they experience nature and interact with wildlife on a regular basis.
Remington and Grant are city-dwellers and have been their entire lives. Remington grew up in Tulsa, Oklahoma and Grant is from Cleveland, Ohio. In Tulsa, Remington fell in love with nature while running on the trails of city parks during cross country and track practices. Grant developed a love for nature while fishing and hiking in the Cleveland Metroparks in Ohio. These experiences led them to study wildlife found in urban environments because they believe that cities can be places where both humans and wildlife thrive. However, to make this belief a reality, scientists must understand how wildlife are using habitats within a city. This knowledge will provide land managers the information they need to create park systems that support all types of species. However, almost all research done on wildlife takes place in natural areas, like national parks, so there is currently very little known about wildlife habits in urban areas. To address this gap in knowledge, Remington, Grant, and their colleagues conduct ecological research on the urban wildlife populations in the Cleveland Metroparks.

Images of wildlife in the Cleveland Metropark’s taken by wildlife cameras. From left to right: Turkey, Coyote, and White-Tailed Deer.
The Cleveland Metroparks are a collection of wooded areas that range in size, usage, and maintenance. Some are highly used small parks with mowed grass, while others are large, rural parks with thousands of acres of forest and miles of winding trails. As they began studying the Metroparks, they noticed the parks were like little “islands” of wildlife habitat within a large “sea” of buildings, pavement, houses and people. This reminded Remington and Grant of a fundamental theory in ecology: the theory of island biogeography. This theory has two components: size and isolation of islands. The first predicts that larger islands will have higher biodiversity because there are more resources and space to support more wildlife than smaller areas. The second is that islands farther away from the mainland will have lower biodiversity because more isolated islands are harder for wildlife to reach. Remington and Grant wondered if they could address this first part of the theory in the Cleveland Metroparks. These parks come in all different sizes. If the theory holds for the Metroparks, it could help them to figure out where most species live in the park system and help managers better maximize biodiversity. It would also provide an important link between ecological research conducted in natural areas and urban ecology.

Remington prepares to attach the camera to a buckeye tree. He secures them with a heavy-duty lock to keep the camera safe from theft by people using the parks.
To evaluate whether the theory of island biogeography holds true in urban areas, Remington and Grant set up 104 wildlife cameras throughout the parks. These cameras photograph animals when triggered by motion. They used these photographs to identify the locations of wildlife in the parks and to get a count of how many individuals there are, known as their abundance. With these data, they tested whether the size of the park would influence biodiversity as predicted by the theory of island biogeography.
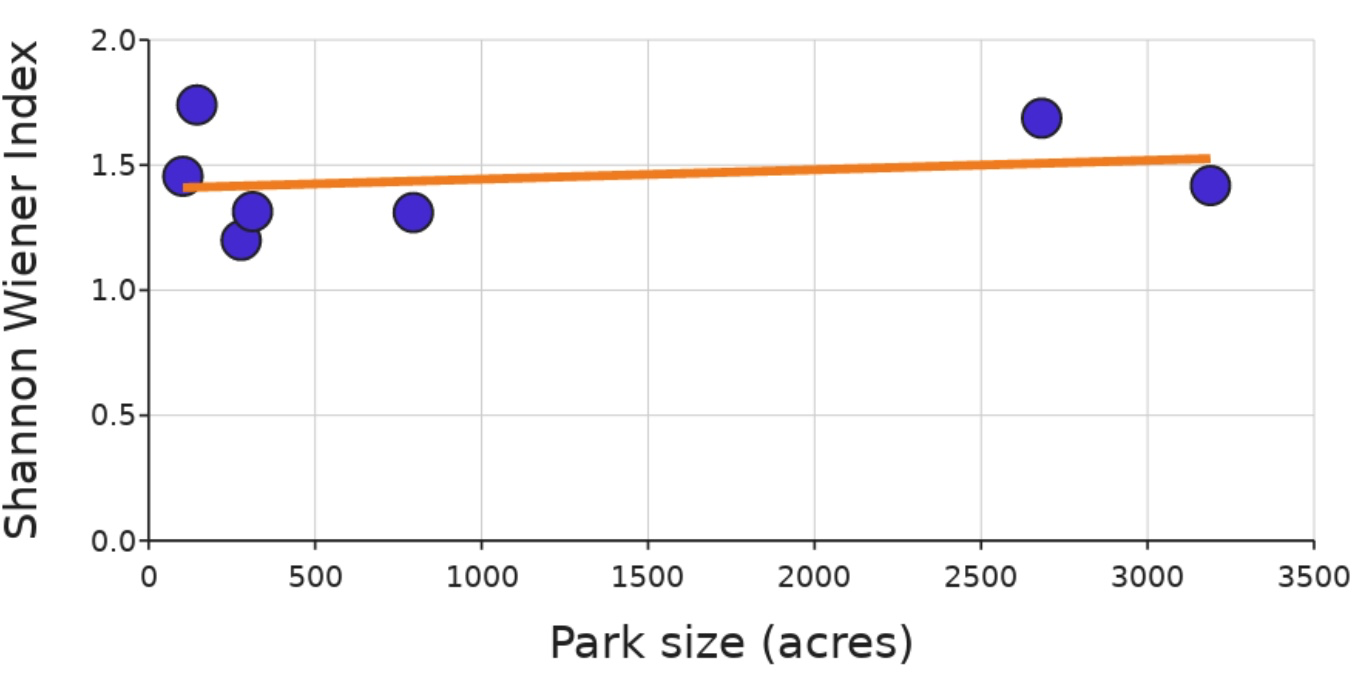
One challenge with measuring “biodiversity” is that it means different things to different people. Remington and Grant looked at two common measurements of biodiversity. First, species richness, which is the number of different species observed in each park. Second, they calculated the Shannon Wiener Index of biodiversity for each park. This index incorporates both species richness and species evenness. Species evenness tells us whether the abundances of each species are similar, or if one type is most common and the others are rare. Evenness is important because it tells you whether a park has lots of animals from many different species or if most animals are from a single species. If a park has greater evenness of species, the Shannon-Wiener index will be higher.

A wildlife camera placed on a tree in the Cleveland Metroparks. Cameras are housed in lockboxes to protect against theft.
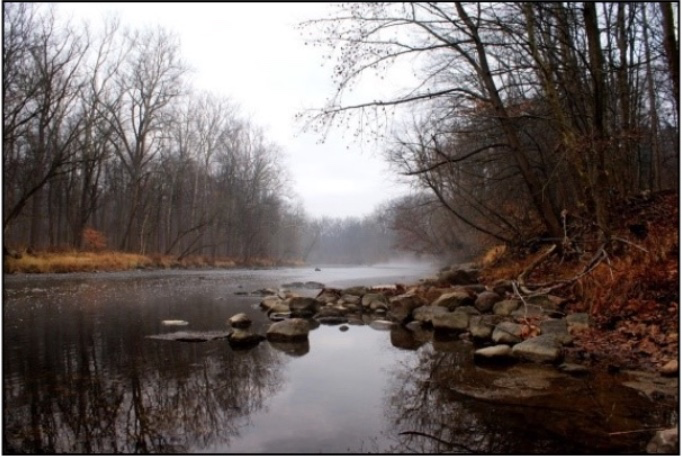
The rocky river runs through several of the Cleveland Metroparks. Remington waded across to hang a camera near its bank.
Scientific Question: How does the theory of island biogeography help explain the distribution of wildlife in the Cleveland Metroparks?
Scientific Data:
What is the hypothesis? Find the hypothesis in the Research Background and copy/paste it below. A hypothesis is a proposed explanation for an observation, which can then be tested with experimentation or other types of studies.
The scientists used two measures of biodiversity in their study – species richness and species evenness. The Shannon Wiener Index takes into account both of these measures. For example, consider the two hypothetical parks below, A and B.

Both parks have the same number of individuals and both have four species represented (deer, raccoons, opossum, and squirrels). But do the two parks have the same level of biodiversity? Describe the differences in the parks and which park you feel is more diverse.
3. What would the species richness be for both parks?
4. How do the parks differ in species evenness? Which park would have a higher Shannon Wiener Index value?
5. What data will you graph to answer the question?
Independent variable(s): ___________________. Dependent variable(s): _____________________
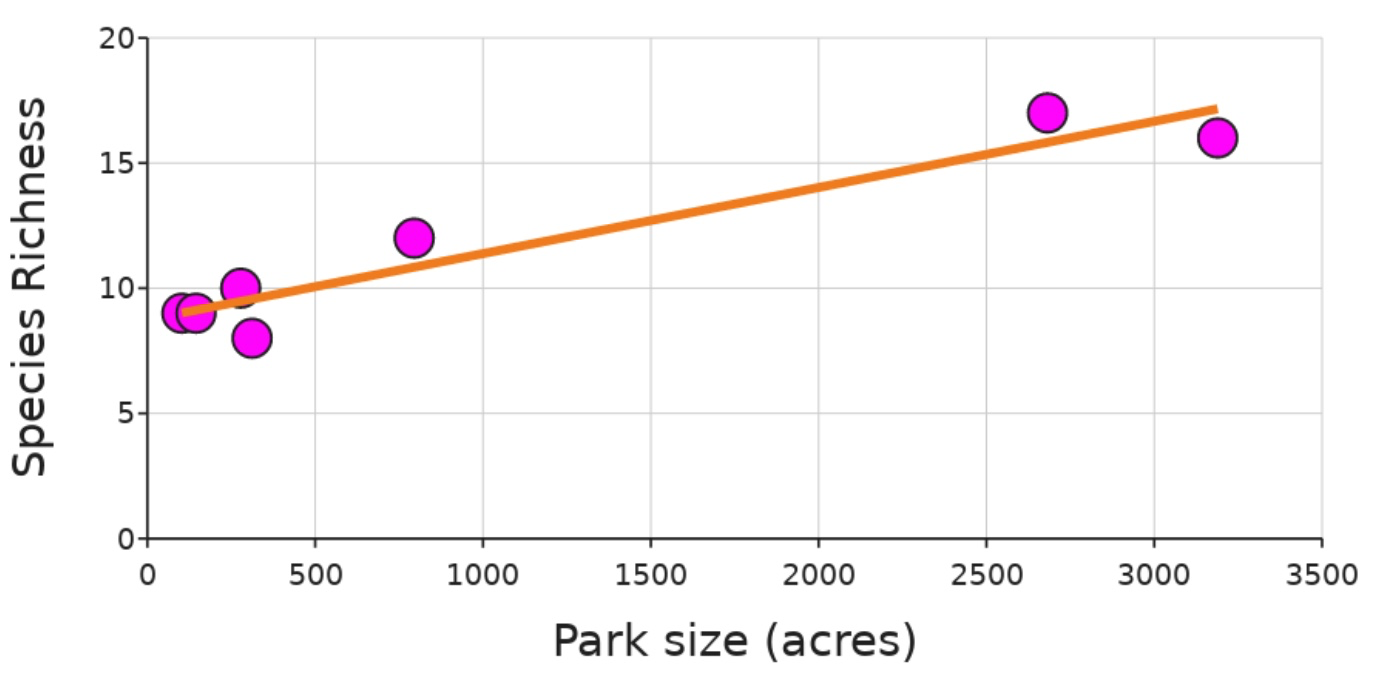
6. Create your graph(s) and paste below:


7. Add a line of best fit with the Regression line check box.Paste your graph which includes your regression line, below. Include your r^2 value next to your graph:


8. Identify any changes, trends, or differences you see in your graph(s). Include your graph and specifically refer to it when describing those changes, trends, or differences.
Interpret the Data:
9. Make a claim that answers the scientific question.
10. What evidence was used to write your claim? Reference specific parts of the tables or graph.
11. Explain your reasoning and why the evidence supports your claim. Connect the data back to what you learned about the relationship between park area and biodiversity
12. Did the data support the theory of island biogeography in urban areas? Use evidence to explain why or why not. If you feel the data were inconclusive, explain why.
Your next steps as a scientist:
13. Science is an ongoing process. What new question do you think should be investigated? What future data should be collected to answer your question?

These questions are a digital extension of the original Data Nuggets activity. The data manipulation and graphing tasks within are best completed here on DataClassroom.
14. Add a line of best fit with the Regression line check box in each of the figures you plotted in Q7. Paste your graph which includes your regression line, below. Include the r2 value next to the graph as well as the equation for the graph:
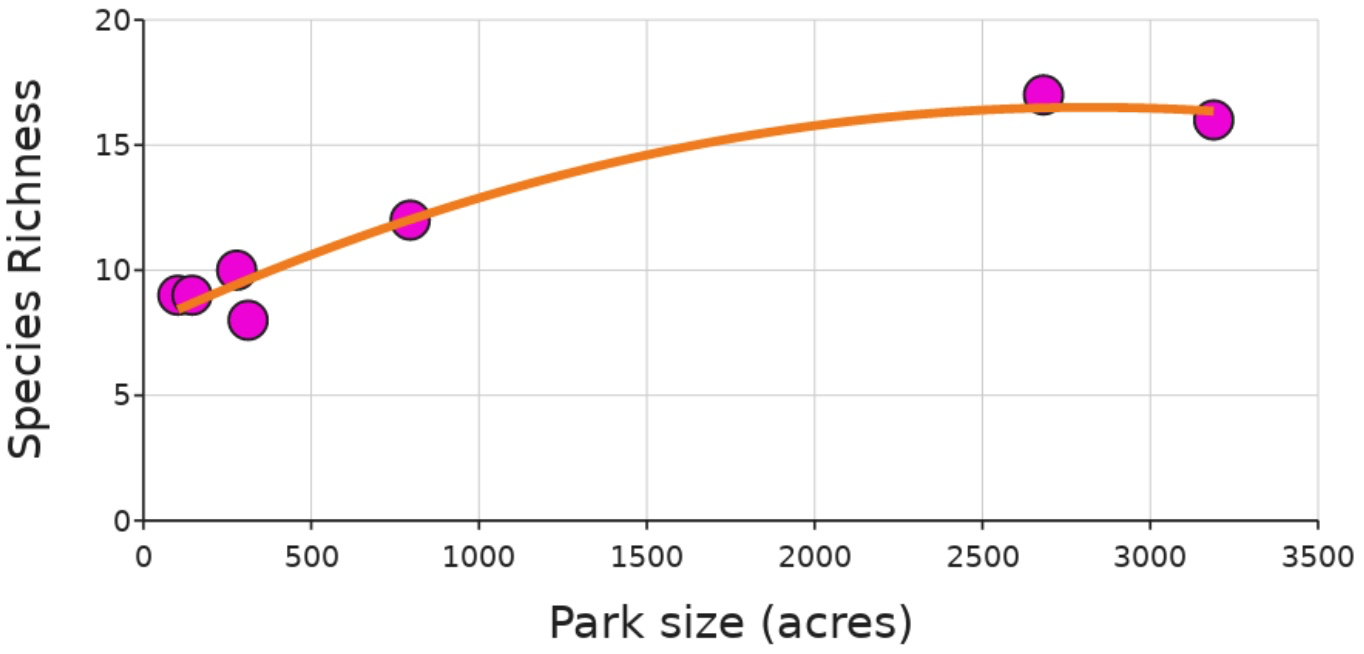
15. Explain in your own words what the slopes indicate and what the r2 values mean in each case.
16. Are these patterns significant? What kind of tests of significance would you conduct and what do they mean? Report the results of these tests in the table below.

17. Make a graph describing the relationship between the two indices for biodiversity used here. To pick specific examples from the data, consider the park name to be a categorical variable and plot it as a Z-variable. Explain if the two variables may be related and what it means if they are not. Paste the r2 value corresponding to this figure. Give an example of a case in which parks similar in one index are vastly different in another and which among them would be considered to be more diverse.

Want an Answer Key? Fill out the form below.
This dataset and content is provided our by our friends at Data Nuggets.
Visit DataNuggets.org to see the original activity and additional materials
