Born to run?
Analyze running cadence data collected with the Vernier Go Direct Respiration Belt to test for effects of shoes on running cadence.

Background
This experiment was designed to investigate the effects of barefoot running, a running trend popularized by Christopher McDougall in the book Born to Run. Traditional running technique emphasizes a heel-to-toe foot strike during each stride. Without the padding provided by traditional running shoes, barefoot running tends to minimize heel strike. This leads to an increase in the step rate of the barefoot runner. Cadence is another word that is commonly used for step rate. Cadence is defined as the number of steps a subject takes per minute.
A pedometer is a device that can be used to monitor steps and step rate. As a result it can be used to measure cadence when walking or running. The Vernier Go Direct Respiration Belt has a built in pedometer that will be used in this experiment. The Go Direct Respiration Belt can be attached to each test subject (your classmates) who then run for a brief period of time while wearing traditional running shoes. The subjects can then repeat the test while running barefoot. The mean cadence in steps per minute (spm) should be recorded for both conditions. The subsequent data can be used to determine if barefoot running changes the cadence of the subject.
Your students can create their own dataset by following the procedure outlined in Vernier Experiment 12 or analyze the example data provided here.
Dataset
This example dataset is simulated but was based on the data from two papers in the scientific literature which recorded running cadence in steps per minute (Van Dyck et al. 2020 and Ekizos et al. 2017). You can record your own data using the Vernier Go Direct Respiration Belt following the procedure linked to above.
Each test subject was monitored for two different trials, one barefoot trial and one conducted while wearing running shoes. In each trial the test subject was asked to run for 60 seconds while wearing the Vernier Go Direct Respiration Belt. The built in pedometer recorded the number of steps. This record of steps was used to calculate cadence in steps per minute.
This example dataset includes 15 male and 15 female test subjects who were each observed running barefoot and with shoes. The data is in Tidy format (each observation gets a row and each variable gets a column) and is 60 rows in length.
If collecting your own data be sure to set up your data in tidy format like this:
Click here for a blank template for this dataset in Google Sheets
Variables

Test Subject ID- This categorical variable identifies the test subject. ID numbers have been used in place of names. Note that if a test subject was observed twice (once barefoot and once shod) then there will be two rows for that test subject in the dataset.
Gender- This categorical variable is self reported by the test subject and can have the value of female, male, or other.
Treatment- This categorical variable can have the value of barefoot or shod.
Mean Cadence (spm)- This numeric variable records the average cadence in steps per minute (spm). It was calculated according to the procedure listed above.
Activity

1.Make a graph showing Treatment on the X-axis and Cadence (spm) on the Y-axis. Check the box to add Descriptive stats to add the mean and 95% confidence intervals to the graph. Use the camera icon to copy and paste your graph here:
2. How did the cadence for both conditions compare? What was the mean cadence when running with running shoes?
What was the mean cadence when running barefoot?

3. Do these data support the hypothesis that running barefoot will increase cadence?
4. Now make a graph showing Gender on the X-axis and Cadence (spm) on the Y-axis. Paste your graph here:
5. Are these data evidence for a gender difference in Cadence (spm)? Explain your thinking.
Statistics Extension
6. Test for a significant difference in Cadence between the barefoot and shod treatments.
Use the Graph Driven Test to select a statistical test. Paste your results below. How do you interpret these results?
7. Test for a significant difference in Cadence between genders.
Use the Graph Driven Test like you did in the last question. Paste your results below. How do you interpret these results?
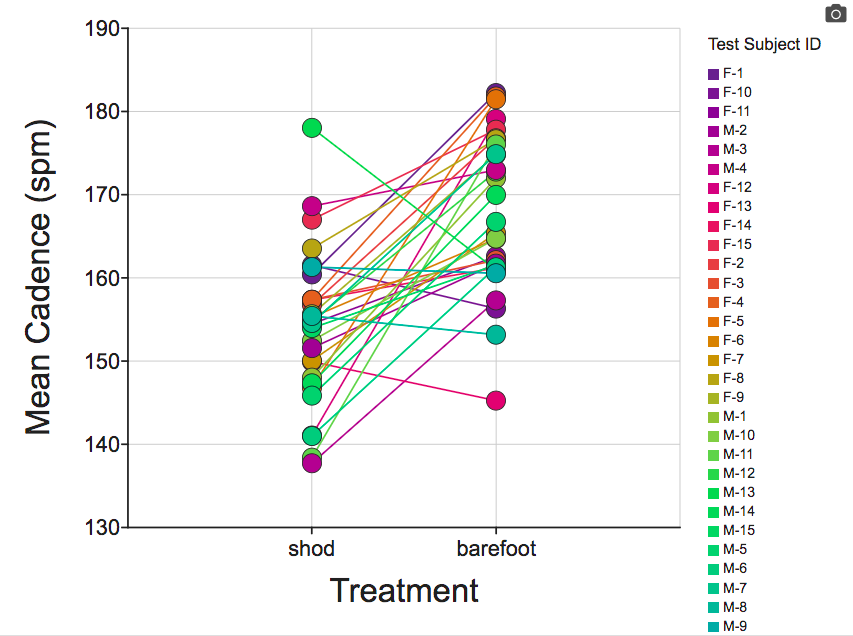
8. The experimental design for this experiment was a classic paired design. That means that the same test subjects were observed under two different sets of conditions. In this case those conditions were running while either barefoot or with running shoes. One of the classic ways to visualize a paired design is a dot plot with connecting lines. Try making this kind of a visualization, paste your graph below.
Hint: You will need to show Test Subject ID as a Z variable and add connecting lines to connect the paired data.
9. What information is visible in the visualization above that was not apparent in the graph you made for number 1? Which visualization of these data (jittered dot plot or dot plot with connecting lines) do you prefer and why?
See a video walk-through of the activity.