Biodiversity on the edge
Mussels as ecosystem engineers in coastal habitats in Nova Scotia

Background
Maintaining biodiversity on our planet is a main goal for conservation. However, when deciding which actions to take to preserve the biodiversity on earth we need to know which factors affect the biodiversity that is found in different habitats. Coastal habitats are important locations for biodiversity and within coastal habitats there are factors that can cause one particular location, or microhabitat, to hold more biodiversity than another. Conservation biologists are interested in understanding what causes biodiversity to be found at one particular location, but not at another location that is nearby.
How can we measure biodiversity?
Part of understanding biodiversity in different locations is having ways to measure biodiversity. Perhaps the simplest way to measure biodiversity is to just count the number of species found within a set area. This is often called species richness. This is distinctly different from the count of individual organisms in a specific area, which is called abundance. Another aspect of biodiversity that is often of interest is evenness. When one or a few species makes up the vast majority of individuals counted for abundance, then the evenness is low. When there are roughly similar individual numbers of most of the species in a specific area, the evenness is considered to be high. Abundance, richness, and evenness are all important for describing the biodiversity found in a particular habitat.
Life on the edge
Coastal habitats in the tidal zone present living things with a variety of challenges. For marine organisms, the risk of drying presents itself when tides are low. When tides are high, the force of the waves and currents can make it difficult for small organisms to cling to exposed rocky habitats. In these habitats mussels can serve as very important ecosystem engineers. These mussels strongly attach themselves to rocky marine habitats and indirectly help many organisms to persist in the challenging environment. The thick, often layered, beds of mussels remain moist at low tide and the spaces in between the mussel shells trap small bits of food and provide some protection against the waves for small invertebrate animals.
With that background in mind a group of scientists from Canada and Argentina teamed up to ask this question:
Does the biodiversity among mussel beds differ between wave exposed and wave sheltered habitats?
Dataset
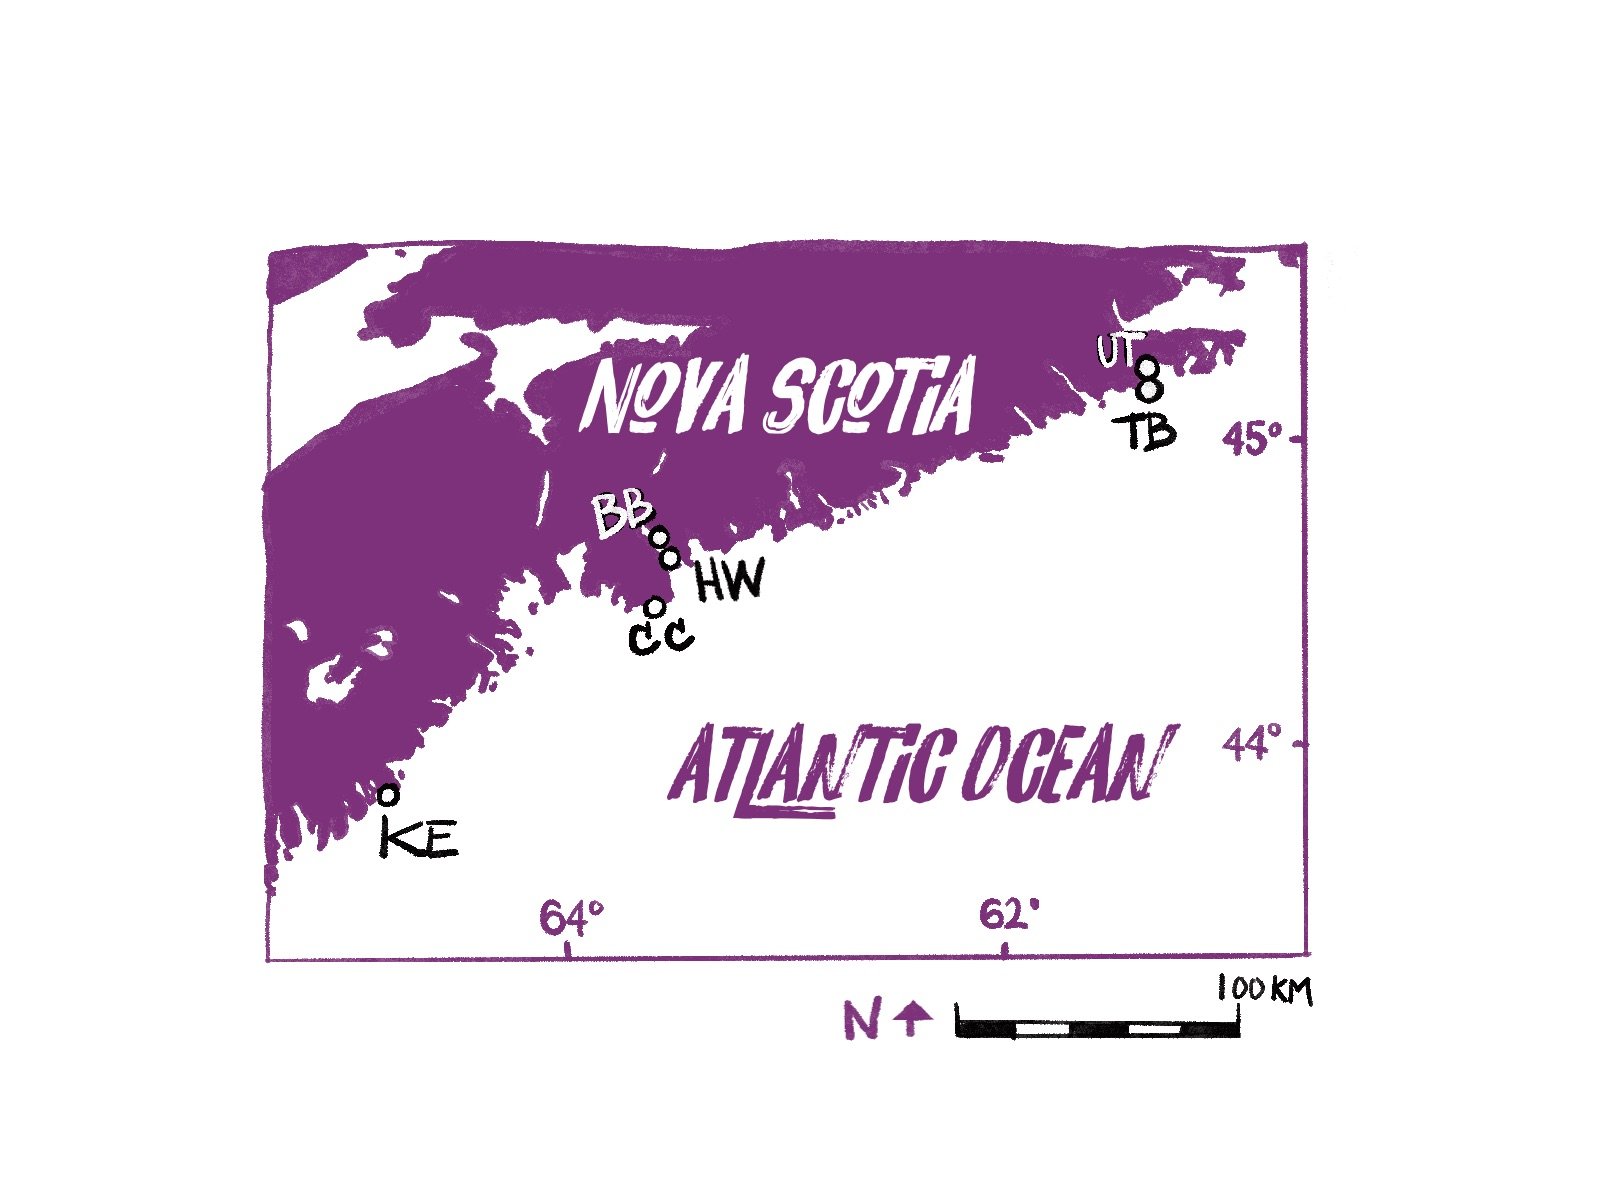
To answer this question the researchers carried out a study that used coastal sites spanning 350 km of Nova Scotia coastline. By sampling organisms from mussel beds in locations that were sheltered from the waves and taking other samples from locations fully exposed to the waves of the open ocean, they were able to collect data to answer their main question.
Specifically the scientists sampled from six sites in the tidal zone. Three were fully exposed to the open ocean(Tor Bay Provincial Park, Crystal Crescent Beach Provincial Park, and Kejimkujik National Park), and three (unnamed site near Tor Bay, Bedford Basin, and Halifax’s waterfront) were sheltered from the waves.
They collected samples from fifteen, 10cm x 10cm quadrats, with locations in the middle of the tidal zone selected at random at each site. Only sites in areas that were 100% covered by mussel beds were selected. Samples were transported to the lab in coolers and all invertebrate organisms >0.5mm in the samples were identified under a microscope using a field guide and taxonomic key. For each sample they recorded the richness, evenness, and the number of invertebrate species.
Variables
Sample- This variable has been coded as info and cannot be used in analysis. It is an identifier for the original sample that was collected.
Location- This categorical variable indicates which of the six sites the sample was collected from. It can have six different values; TB-Tor Bay Provincial Park, CC-Crystal Crescent Beach Provincial Park, KE-Kejimkujik National Park, U-unnamed site near Tor Bay, BB-Bedford Basin, or HW-Halifax’s waterfront.
Habitat- This categorical variable indicates whether a site exposed to open-ocean waves or sheltered from open-ocean waves. It takes the value of either sheltered or exposed.
Total Species- This numeric variable is the number of species recorded in a sample.
Abundance- This numeric variable is the total number of individual invertebrates recorded in a sample.
Species Richness- This numeric variable is the number of species divided by the size of the area samples.
Evenness- This numeric variable is calculated by dividing Shannon’s diversity index (not presented here) by the natural logarithm of species richness. It ranges from zero to 1.0, with zero meaning no evenness and 1.0 meaning complete evenness.
Activity
Get familiar with the dataset
Teacher Note:
This activity is open ended in that it does not direct students to make specific graph types when answering the questions below. If your students need additional support in choosing an appropriate graph type we recommend pointing them to Graph Wizard.

Graph produced to compare average number of organisms collected across locations.
Which of the six sampled locations had the greatest average number of individual organisms collected?
2. What is the relationship between total species found in a sample and abundance?

3. What is the relationship between total species found and species richness?
4. What is the relationship between total species found and species evenness.
Answer the main questions
5. Does the biodiversity among mussel beds differ between wave exposed and wave sheltered habitats?


6. If you only had data from one of the three sheltered locations and one of the three exposed locations, would you be likely to reach the same conclusion as you did in question #5?
7. Based on the background information which of the benefits provided by mussel beds to invertebrates is likely to explain how exposed habitats can still maintain high biodiversity as seen in question #s 5 and 6?
Statistics Extension
8. Construct the graph that you built for #5. Conduct a statistical test using the Graph Driven Test. What
is the p-value produced by this test? An interactive analysis can also be used for this if you wish.
9. What is the question that you are asking with this statistical test?
10. Describe the level of confidence you have in your response to #5 based on the data you have to work with here?
Source Data:
The data in this activity come from a study by Dr. Lorena Arribas and colleagues. Special thanks to Dr. Arribas for sharing the raw data from that study.