How to Choose a Statistical Test

For Science Fair, Class Lab, or Real Research
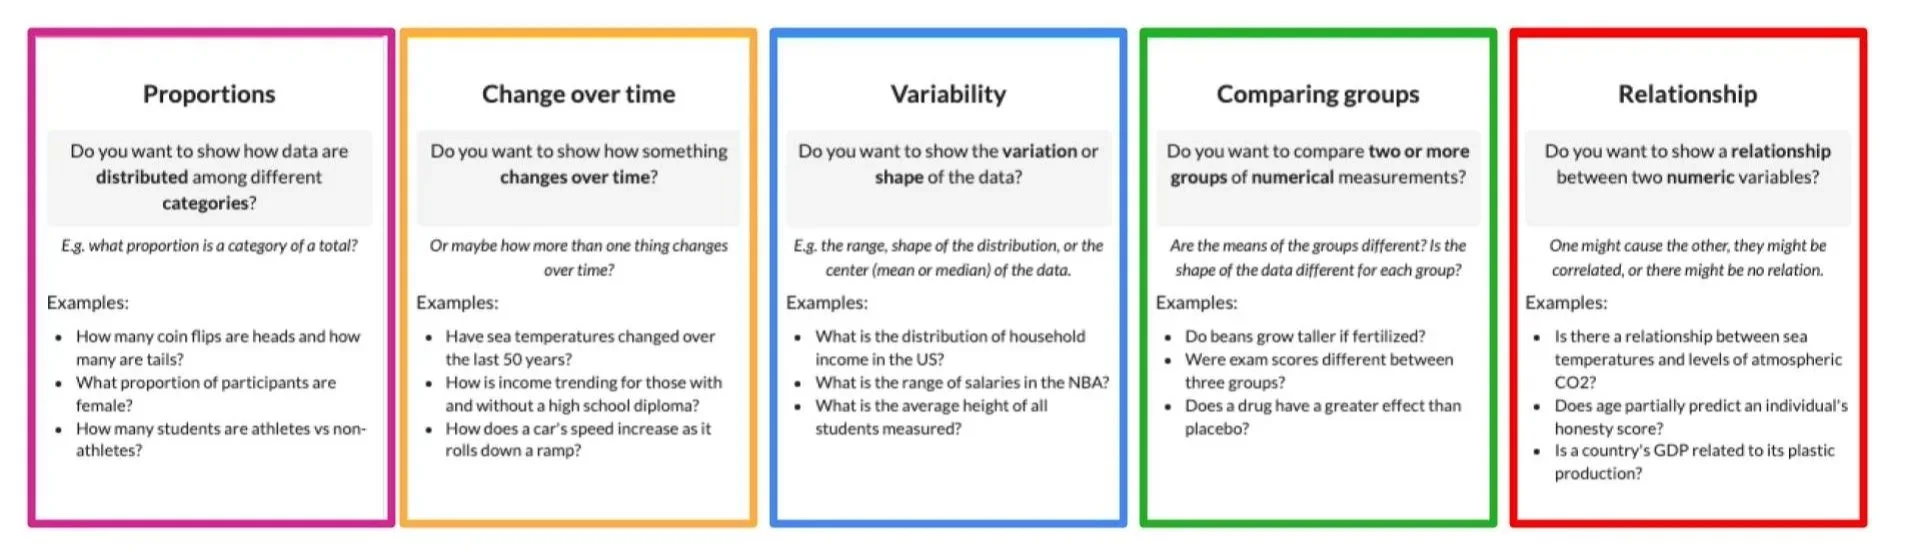
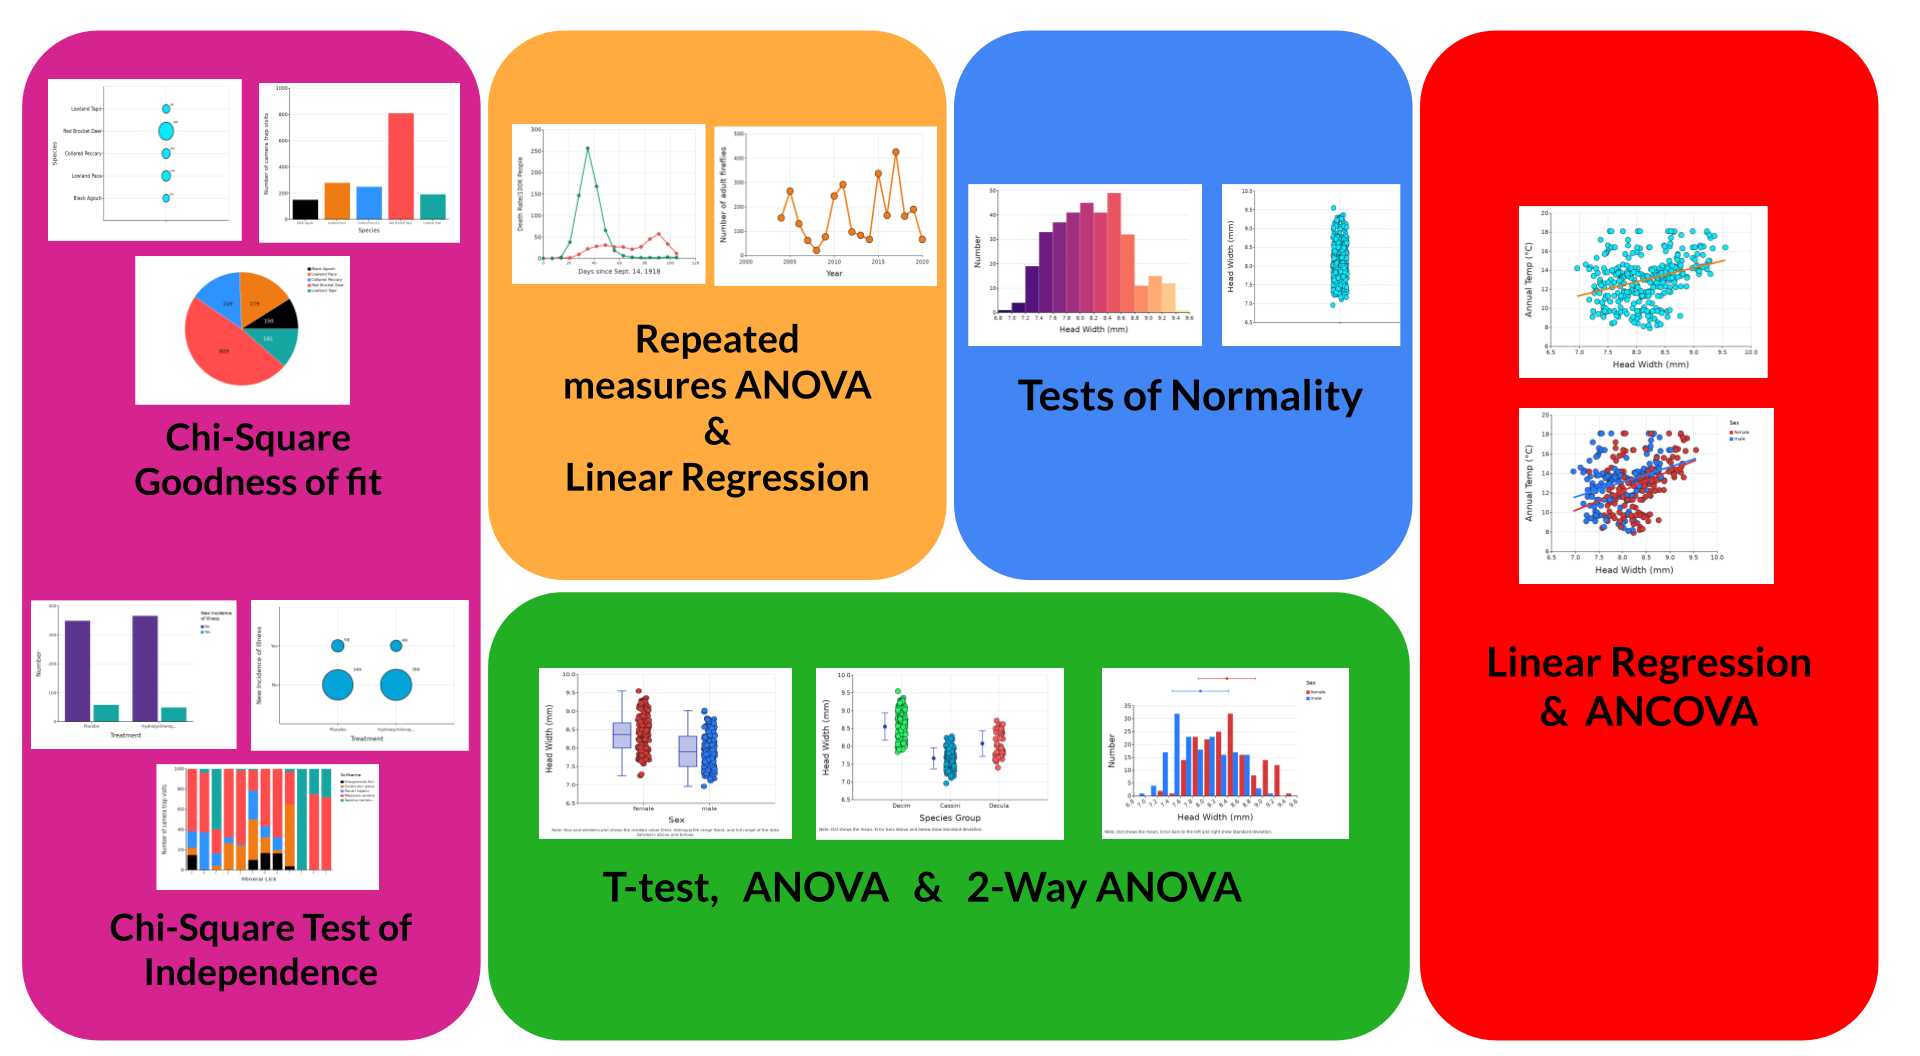
How do you choose the right statistical test? Start with your research question, choose the right graph, and the correct test becomes clear. This simple framework — based on a graph choice chart from The Science Teacher journal — helps middle school, high school, and college students pick the right statistical test every time, whether for science fair, AP Biology, or IB Science.
Resources from the video
Interested in a bit more?
This webinar dives deeper into making better graphs - from data formatting to graph presentation and into statistics
Explore the Graph Choice Chart from the Maine Data Literacy Project.
Check out more Statistics Snippets.
Subscribe to the Statistics Snippets playlist on Youtube.