What affects the rate of cellular respiration in plants?
This data activity can be supplementary to AP Bio Investigation #6

Background
Cellular respiration is a process essential to all life on earth. The rate of cellular respiration is influenced by many factors affecting the plants, animals, and other organisms which depend on cellular respiration to convert food into energy at the molecular level. This process can be observed in plants because we can readily measure the outputs of respiration and control for factors impacting plant respiration. Furthermore, studying respiration in plants can inform our understanding of respiration in other organisms.
For instance, scientists from Lanzhou University undertook an investigation to determine the relationship between the amount of phosphorus–a key nutrient affecting plant growth and often found in fertilizer- and the respiration rates of plants by comparing the rate of respiration for different plants of varying phosphorus content. These scientists predicted that they would find some relationship between phosphorus and cellular respiration. Would the relationship change depending on variables like type of plant or environment, or is the relationship between phosphorus and cellular respiration the same across a wide range of plants and environmental conditions? In order to do so, scientists studied woody deciduous (trees) and herbaceous (leafy) plants in a greenhouse and in their natural habitat. Then they measured the rate of respiration and amount of phosphorus in both plant types and in both locations.
Dataset
Relative phosphorus content (controlling for the size of the plant) was measured by drying the plants to determine their dry weight (30 minutes at 120 degrees Celsius). Then, after dissolving away the carbon and other elements using sulfuric acid/hydrogen peroxide digestion, molybdate/ascorbic acid method was used to determine the remaining phosphorus content.
The respiration rate was measured using the Li-800 automated CO2 flux system, which works using the ideal gas law just like a basic syringe-respirometer (like you may use in AP biology class!), but with industrial-level precision.
Variables
The variables should be explained and defined very clearly so that logical conclusions and interpretations can follow from analysis.
Log of total relative plant phosphorus - This numeric variable is the grams of phosphorus isolated from the rest of the plant’s mass using the process described above. In order to make the data easier to evaluate, the study used a logarithmic transformation.
Log of total respiration - This numeric variable is the number of moles per second of respiration by-products, where mole is a measure of the amount of a substance using Avogadro’s number (6.022 x 10²³ atoms per mole). Just as with the phosphorus content, the respiration rate was subjected to a logarithmic transform to show the relationship with phosphorus content.
Location - This categorical denotes the location samples were recorded at. “Field” denotes samples from a site on Cuiying Mountainor, while “Greenhouse” denotes samples grown in Lanzhou University’s Yuzhong Experimental Station.
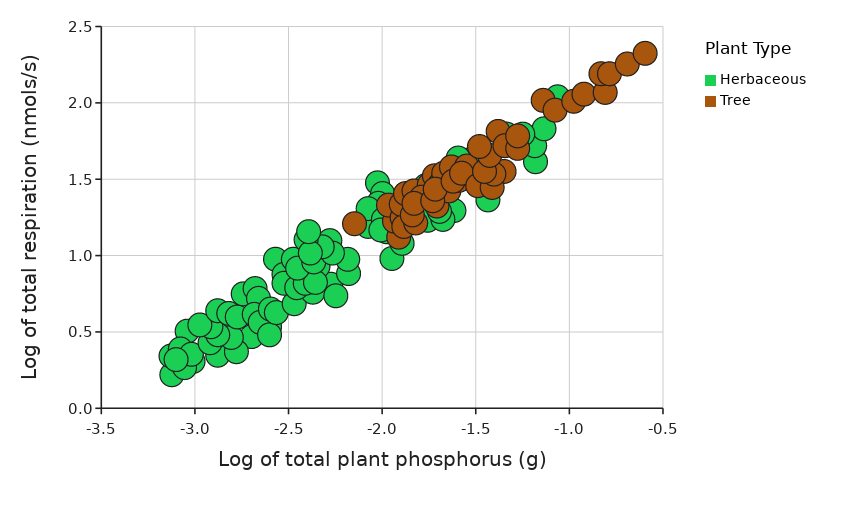
Plant type - “Herbaceous” plants are plants with non-woody stems and “Tree” plants are, you guessed it, trees. This is a categorical variable.
Activity
Make a graph to examine the relationship between the amount of phosphorus in a plant and the rate of respiration. The amount of phosphorus should be on X and rate of respiration on Y.

2. Set the Location variable to “Show.” Before selecting it as your Z for the graph, do you think that plants grown in the field or in a greenhouse will have a greater respiration rate? Why do you think that is the case? Now, set it as the Z.

3. Do the same guess-and-check for Plant Type. If you’d like to investigate whether there is a statistically significant difference in respiration rates, please see the statistics extension activity below.
4. Add a regression line to help you predict the rate of respiration for a plant with a total plant phosphorus of 10 grams. What do you notice about the relationship between plant phosphorus and respiration, regardless of location or plant type?


Stats extension activity:
5. Where do you think the scientists observed a greater rate of respiration? In the field, where the plants were in their natural habitat, or in the greenhouse, where scientists were able to tend to them in a controlled environment? Create a graph with Location on the X-axis and Log of total respiration (nmols/s) on the Y-axis. Use a t-test to analyze the difference. You can do this with the Graph Driven Test (on the right next to the Appearance menu) or with the Interactive t-test accessible from the table view.


6. Follow the same process as above, but use Plant Type as your dependent variable.

