Struck Gold? A density investigation
Use mass and volume data to calculate density

Background
On a school trip to explore the history of the gold rush, your class has the opportunity to try sifting for gold in a stream. You find a little corner of the stream all to yourself and give it a go.
After a while, you see you’ve collected many bits of golden nuggets and flakes! Some look identical, and some only similar. While you had hoped you could identify gold, your inexpert eye simply can not pick out exactly which rocks, if any, are actually gold. It’s time to use your knowledge of density to know for sure!
After grouping the samples that look identical, you realize you may have five different types of metals. You call them types A, B, C, D, and E. You do some googling, and realize your metals could be any of the following types:

Photo credit for pinchbeck, bronze, brass, gold, and fools gold
By measuring the mass and volume of each sample, can you find a clear relationship to know for sure if you’ve struck gold?
Dataset
This dataset is simulated data generated by using theoretical data and calculations, with inclusion of likely equipment error. Each datapoint represents a different amount of a sample. By taking measurements on varying amounts of each sample, we can create a trend or relationship between mass and volume to be analyzed.
Variables
Type- this categorical variable describes the name given to each rock type you identified by observation.
Mass - this numerical variable describes the amount of material within an object. It is not the weight. Measured in grams (g).
Volume - this numerical variable describes how much space it takes up. Measured in centimeters cubed (cm^3)
Activity
Make a graph of volume on the x-axis and mass on the y-axis. Select sample for the z-axis and paste your graph below:

2. Write any initial observation of the samples based on this graph.
3. What is the relationship between the data for each location? Add a regression line for each location and group by z. Paste your new graph below:

4. List the equation for one of the samples below. Change any y and x within your equation to the specific variables from the graph.
5. What is the unit of your slope? What is the meaning of that unit?
6. Rewrite your equation using only variables and no numeric values:
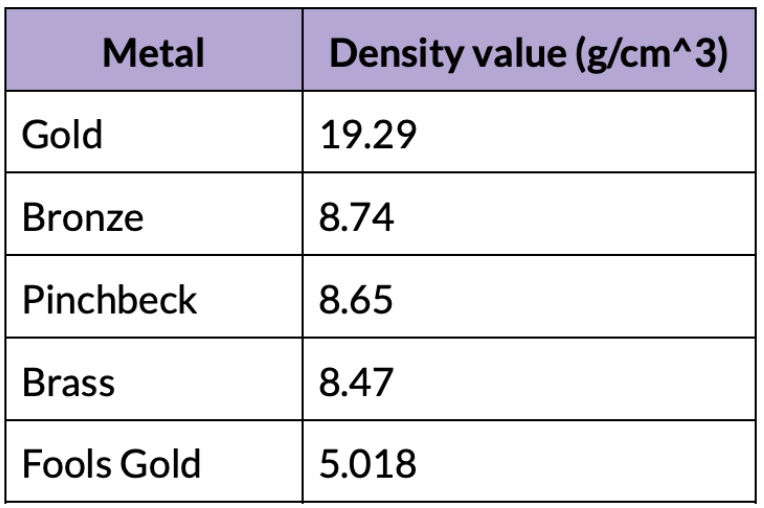
7. The following chart is the density values for the various metals which appear like gold:
_MET_DP170900.jpg)
_4_(16848647509).jpg)
Use your data and this table to provide evidence for the samples you were handed. Use the claim-evidence-reasoning format to discuss your findings.
Extension: Alloy vs. Mineral vs. Element
Looking at the different samples that you have, which must have come from discarded artifacts which wore down over time? Provide reasoning for your answer.