The Stroop Effect Part 1
How does color interference affect reading time?
Work with data from this classic experiment.
Analyze a classic experiment in psychology with this dataset based on the original 1935 paper by John Ridley Stroop. Activities from Stroop’s original datasets are spread across 3 separate activities, it is recommended that you complete them in sequential order to get the most out of them.
Part 1 - How does color interference affect reading time?
Part 2 - How does word interference affect reading time?
Part 3 - How does practice influence interference?
Background
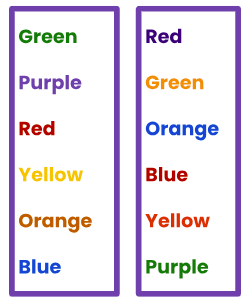
Try reading out loud the words written on the left and then try it on the right. Notice a difference? Did you find yourself taking longer to say words on one of the sides? If so, you weren’t alone in feeling impeded due to the Stroop effect!
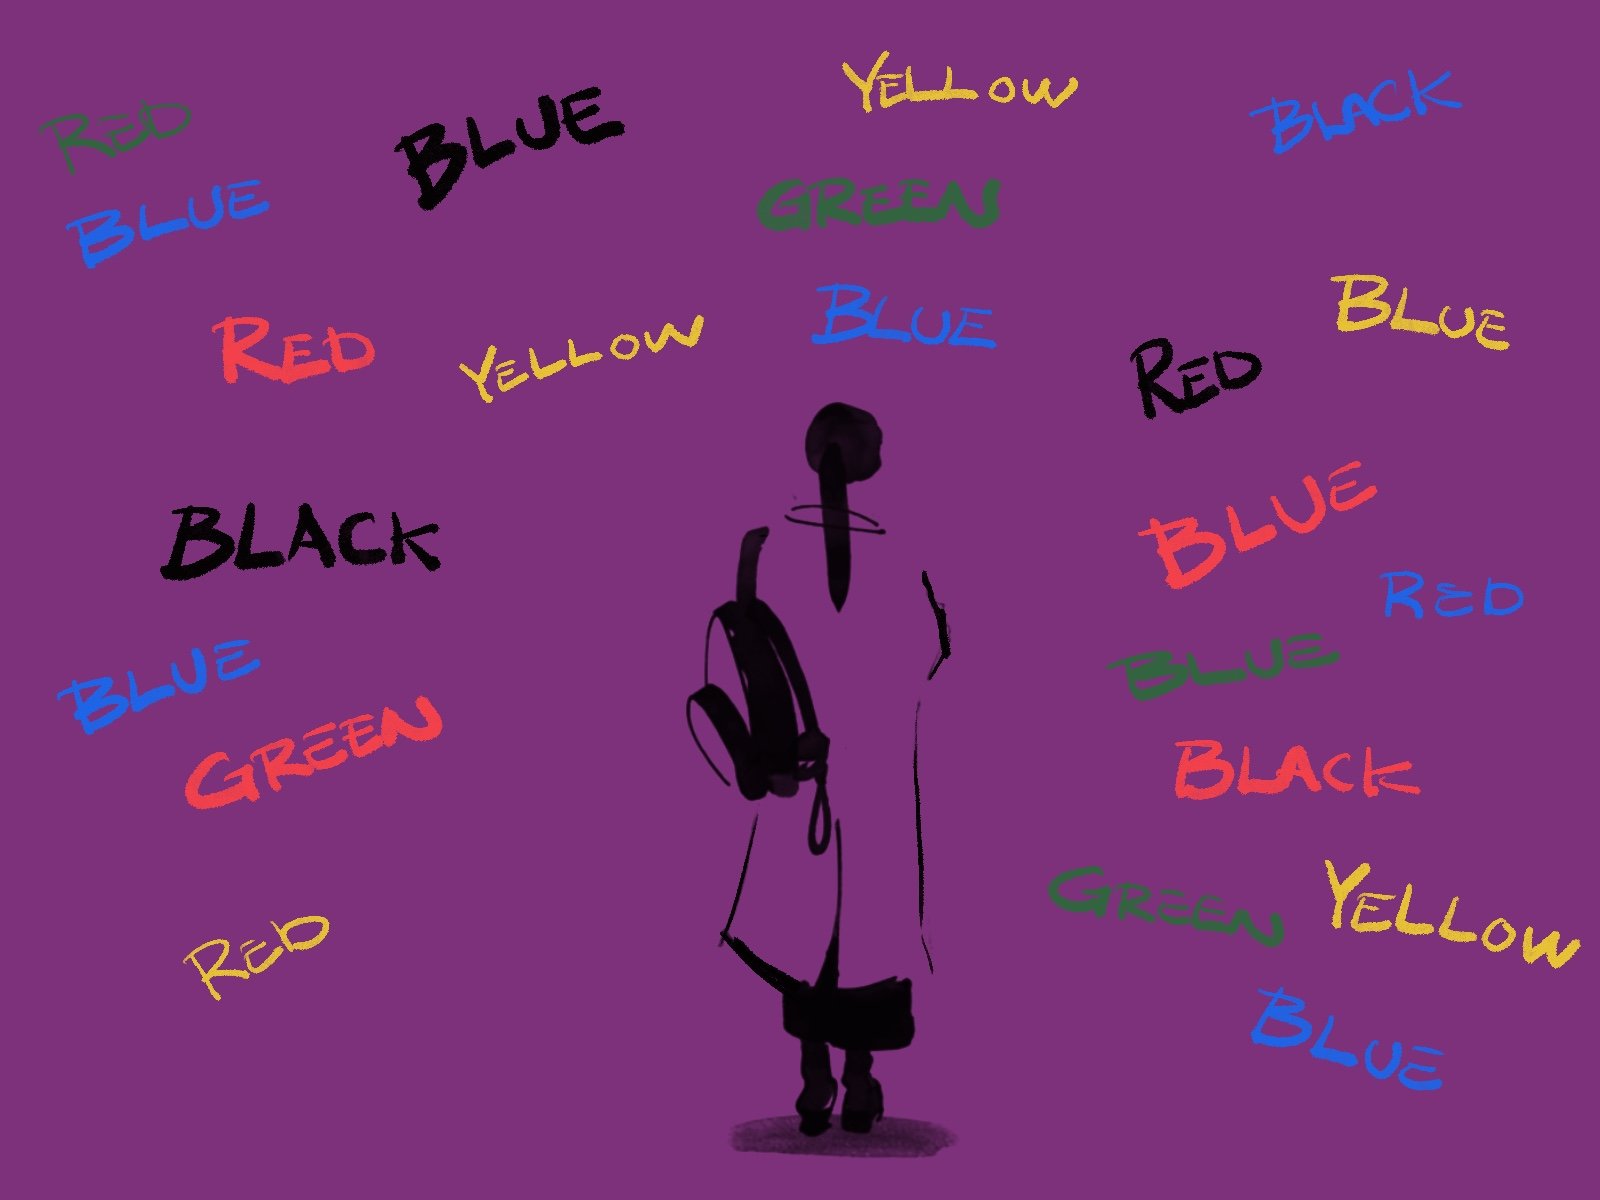
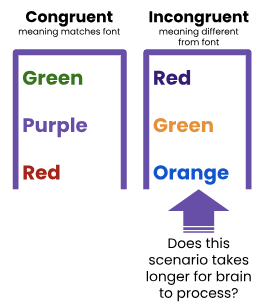
The Stroop effect refers to a phenomenon in which our response time is delayed by incongruent stimuli. For example, in the task above, one’s ability to read the words or name the ink color in which the word is printed on the right side is hampered due to the presence of conflicting information, either due to a mismatch between the font color and the color that word represents. This effect is thought to be a result of our internalization of an existing relationship between a word and its associated visual representation and is hypothesized to occur because of how we learn and process naming colors as opposed to reading words. Although psychologist John Ridley Stroop was not the first to detect such an effect, he developed one of the most effective and replicable sets of tests to study it in an elegant study first published in 1935 (full text can be found here).
While there is no general agreement on the underlying cause of this effect, the Stroop test has played a critical role in psychological research and clinical psychology. This is because of its capacity to reveal how the brain processes information and the extent to which individuals can override their instinctual fast thinking which causes them to rely on the learned association of words and their visual representation. The test is often used to measure a person’s selective attention capacity and skills, processing speed, and (alongside other tests) executive function difficulties due to ADHD, anxiety, depression and even traumatic brain injury. Typically with these tests, psychologists predict that if an individual’s executive functioning is not strong, they are likely to take longer to process incongruent stimuli because of their inability to inhibit interference due to known automatic associations between two stimuli.
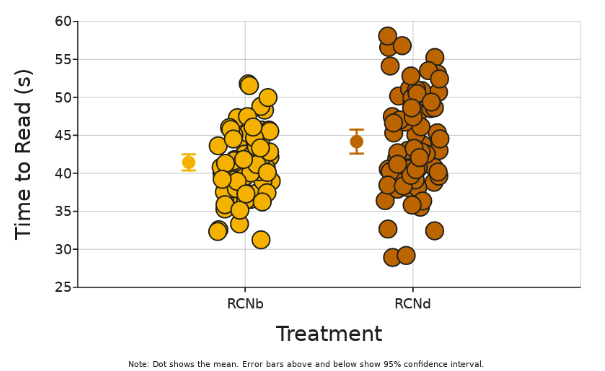
In the first part of the study, Stroop wanted to test whether the presence of conflicting visual stimuli (colors that are not indicated by words) impede our ability to process information quickly. He recorded the time it took participants to read the names of colors from a list printed only in black ink (RCNb), and then recorded the time it took them to read names of colors from a list where the color of the printed text was different from the color named by the word (RCNd).
What were Stroop’s results? Explore the data to see how the experiment played out, and answer these three big questions:
How are the data distributed?
Does the incongruency of words and their color affect the ability to read the words quickly?
Do males and females differ in their performance on the Stroop test?
Dataset
This data is recreated from Stroop’s first experiment, with participation from 70 college undergraduate students (14 men and 56 women). He recorded the time it took participants to read the names of colors from a list printed only in black ink (RCNb), and then recorded the time it took them to read names of colors from a list where the color of the text was different from the color named by the word(RCNd).
The dataset below has been recreated from the reported summary statistics in Stroop’s iconic 1935 paper.
When reading the names of colors from the RCNd list, participants were allowed to re-read the names if an error was made in reading the names, and was included in the total time to read. (This time delay is called color interference).
Variables
Participant ID: A unique ID given to each participant. This variable is categorized as info and will not be analyzed.
Sex: This categorical variable indicates whether the participant was male (M) or a female (F)
Participant’s Year of Study : This categorical variable indicates whether the participant was in undergraduate (1st-4th Year) or Graduate school
Treatment: This categorical variable is the type of word list that participants will have to read in a given experiment. Variables include reading color names printed in black ink (RCNb) or reading color names written in ink printed in a color different from the one written (RCNd).
Time to Read (sec): This numeric variable is thetime it took for a participant to read the associated word list, measured in seconds.
Activity
1) State the scientific question that Stroop wanted to study:
2) What was Stroop’s hypothesis of this experiment?
3) What variables would you need to explore the question? State your prediction of those variables below:
Big Question 1: How are the data distributed?
4) Make a graph to show the distribution of the reading times for both treatment groups in the experiment. Make a histogram and paste it here:

5) Add box and whisker plots to further illustrate the distribution of the data, and include your new graph (histogram with box plots) below:

6) What does the box and whisker plots tell us about the distribution of these data?
Big Question 2: Does the incongruency of words and their color affect ability to read the words?
Let’s create an alternate data visualization for this next set of analysis questions.
7) Display a dot plot of reading time against the two treatments by putting treatment as x-variable and Time to Read as y-variable. Include your new graph below:

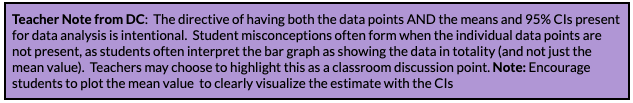
8) Find the mean and 95% confidence intervals by adding descriptive statistics to the graph above. Screenshot and include this new graph below:
9) Based on this graph, is there a difference between processing the two different types of words? (In other worlds, does color interference seem to affect reading time?)
Big Question 3: Do males and females differ in their performance on the Stroop test?
10) Explore this question by grouping data with a second categorical variable Z- variable in the DataClassroom interface) to indicate the gender of the participants. Keeping the same graph from #8, make Sex your z-variable, and paste your graph below. (Continue to include the mean and 95% CIs)

11) Based on this graph, how does sex affect the outcome of time to read when color interference is present?
12) What statistical test would you use to test if color interference had a significant role in affecting reading time regardless of the gender of the participants? Explain why?
13) Using the appropriate graph-driven hypothesis test - report your results in the table below and explain your inference regarding the strength of color interference in reading.