Precisely the right tool for the job:
Glassware Precision and Accuracy Activity

Introduction
If you’ve ever been in a chemistry lab, you likely noticed the wide variety of glassware for use in experiments. Not all glassware is equal, however. The specific glassware you’ll use in a particular experiment will depend on the exact measurements and tasks required to complete that experiment. For example, when measuring a volume of solvent to dissolve a solid, the amount of solvent used does not usually need to be exact. As such, the type of glassware used for this task is not as significant. However, when doing analytical experiments, the quantities of different substances used in the investigation must be exact. Examples of analytical experiments include determining the concentration of an unknown hydrochloric acid solution (a procedure known as titration) and determining the mass of an ion present in an aqueous solution of unknown concentration (a technique known as gravimetric analysis).
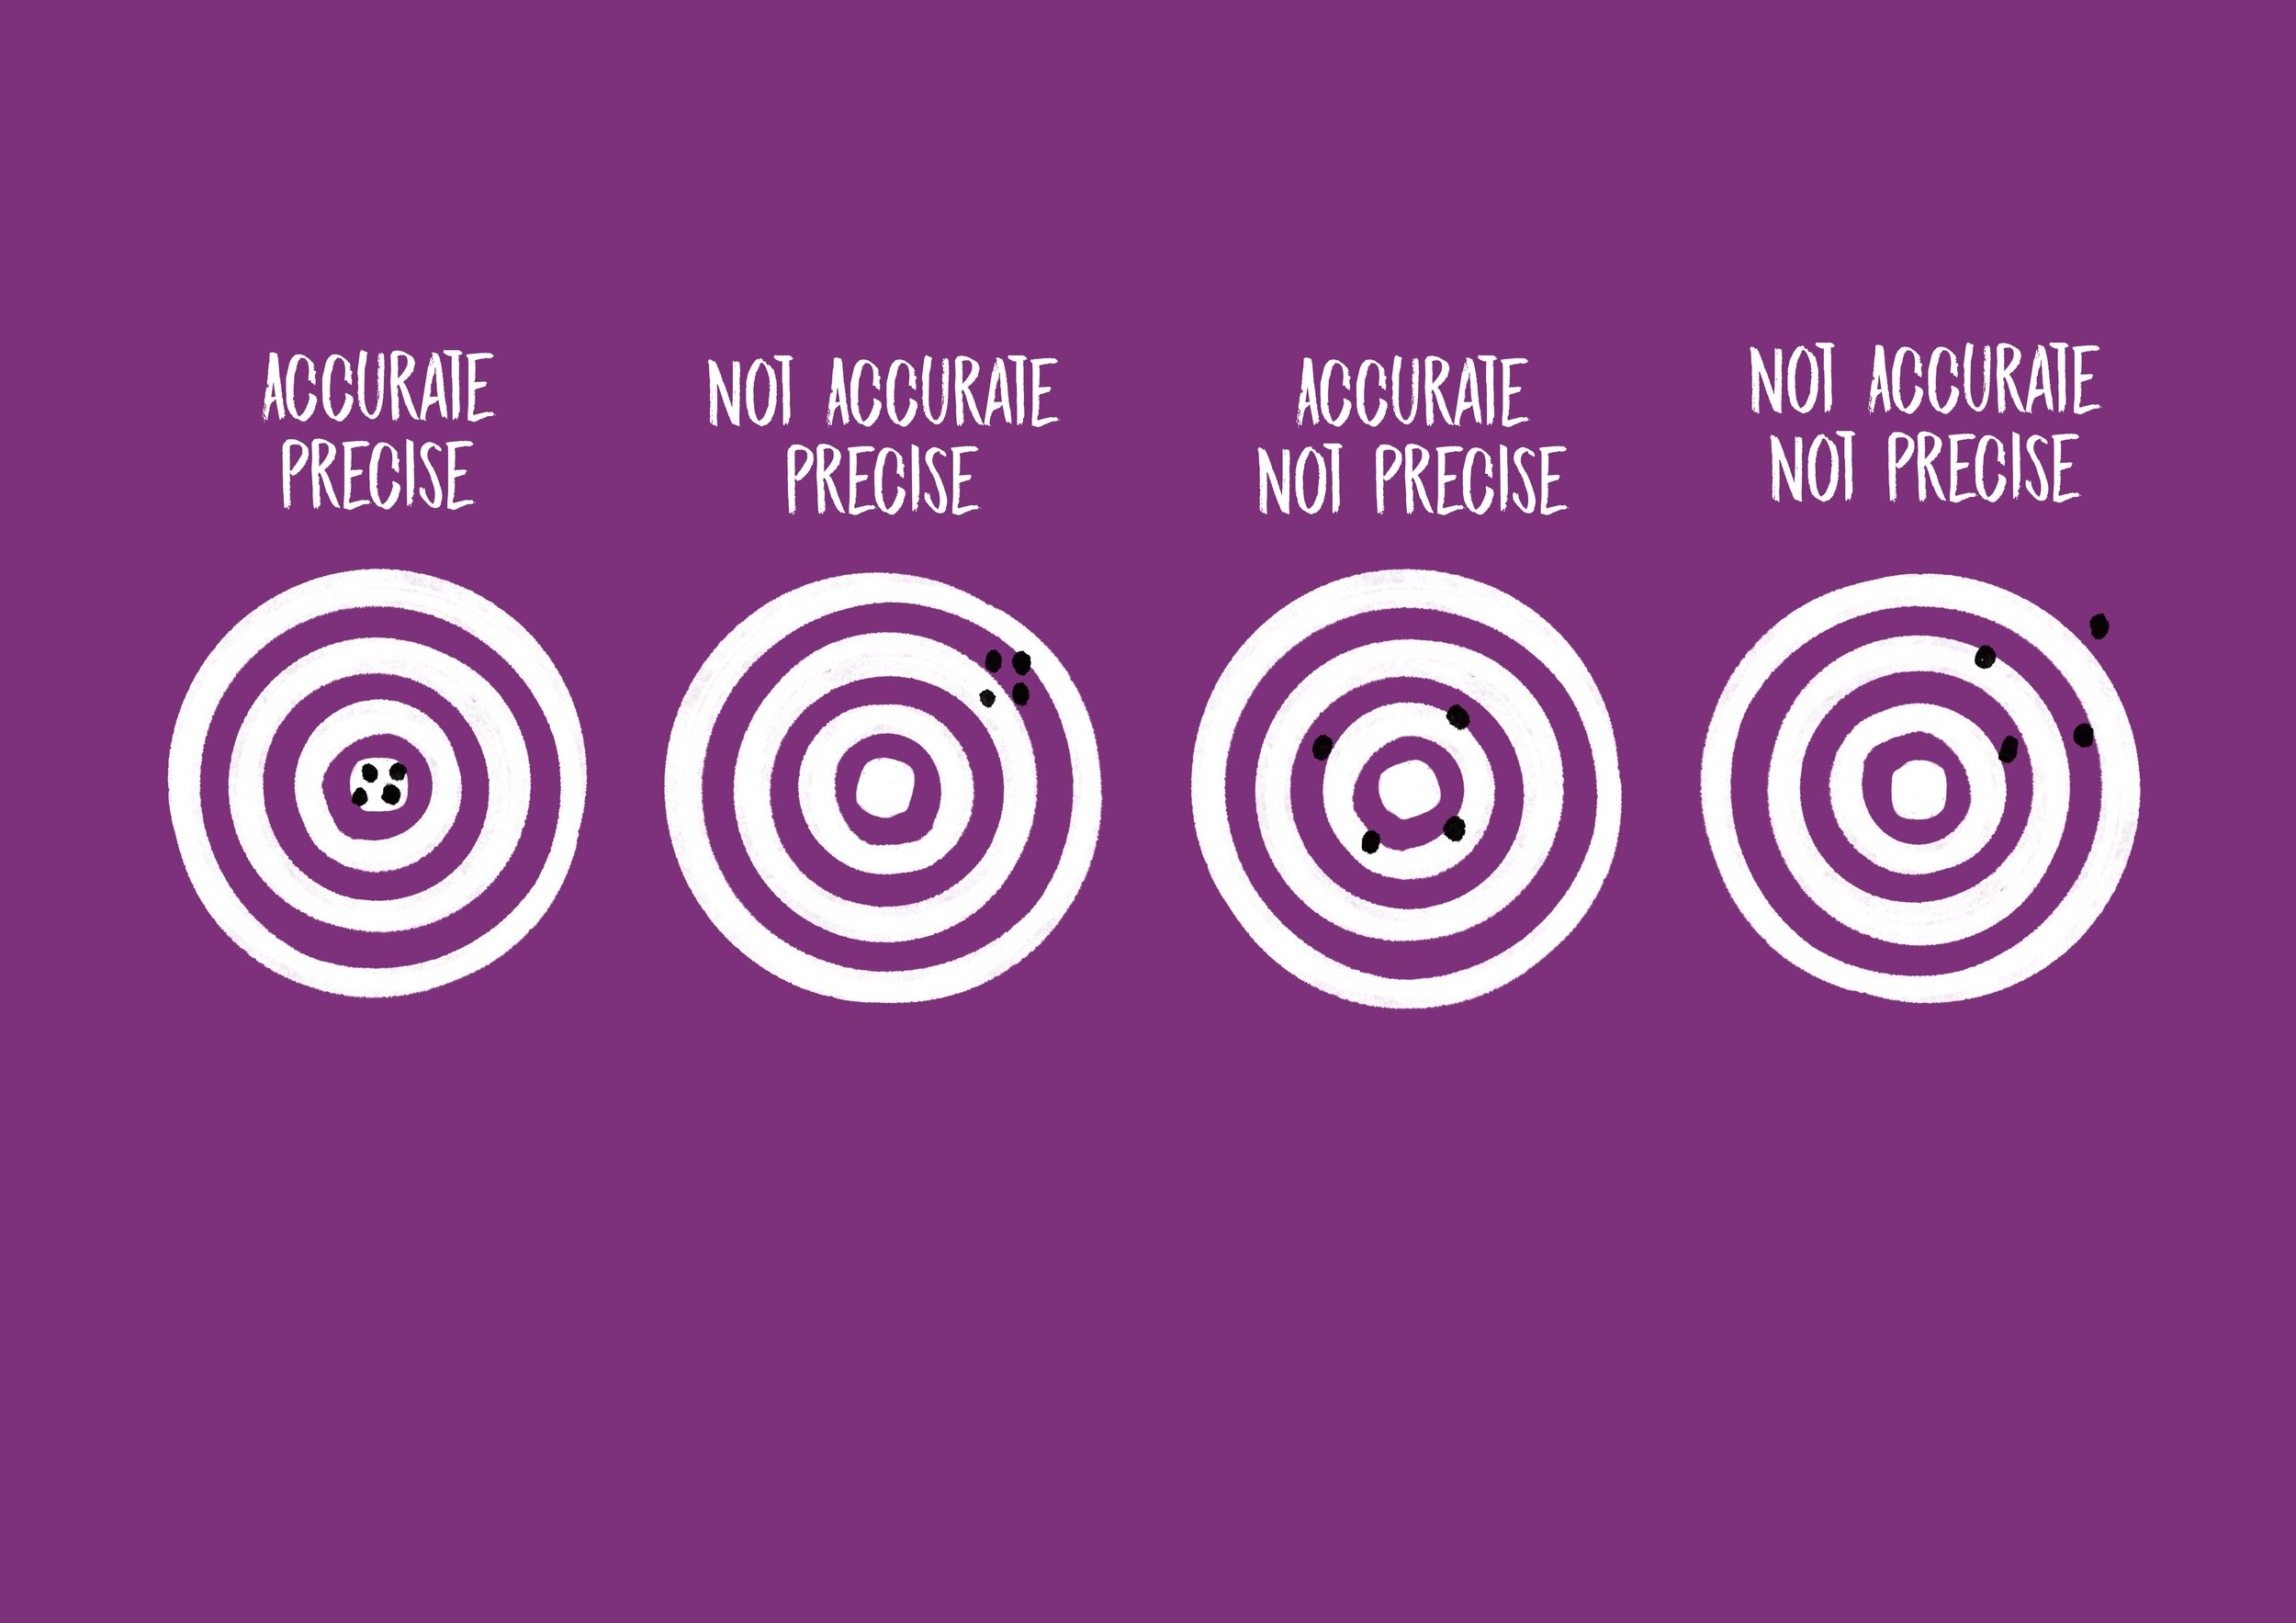
Numerous types of glassware are found in a chemistry lab, including beakers, graduated cylinders, Erlenmeyer flasks, pipettes, volumetric flasks, and burets. Each of these types of glassware has a precision value that refers to how closely a series of measurements will be to one another. For example, a measurement of volume using a 10 mL beaker is precise to within ±1 mL. If a volume of liquid measured in that beaker is determined to be 8 mL, the actual volume may be as low as 7 mL or as high as 9 mL. A 10 mL graduated cylinder, however, is precise to within ±0.1 mL. A measurement of 8 mL taken in a 10 mL graduated cylinder may mean the actual volume of the liquid is as low as 7.9 mL or as high as 8.1 mL. This range is much smaller, and thus the measurement taken with the graduated cylinder is much more precise than the one taken with the beaker!
Another essential component of taking a measurement is accuracy, which refers to how closely a measurement adheres to an accepted value. For example, the accepted density of water is 1 g/mL. Suppose that you take some measurements in the lab and calculate the density of water to be something other than 1 g/mL. This outcome suggests your measurements were inaccurate due to the presence of some kind of error. This error might come from misusing an instrument - for example, forgetting to zero a balance before massing a sample or not using the bottom of a meniscus to measure volume in a graduated cylinder or buret - or from an instrument that is not correctly calibrated.
The Dataset
The dataset you’ll use in this activity was collected by students from Pasadena City College in Pasadena, California. The students massed exactly 1.0000 g of water and determined the volume of this mass of water using five different pieces of glassware: a graduated cylinder, an Erlenmeyer flask, a beaker, and a volumetric flask. The students took multiple volume measurements with each glassware type. Using the masses and volumes and the formula density = mass/volume, the students calculated the density of water based on each volume measurement. The dataset contains the density calculations rounded to four decimal places.
In your analysis, you’ll examine the density calculations determined by the students based on their volume measurements. You’ll use this data to create a graph that will help you describe the precision and accuracy of the four pieces of glassware listed above.
You can use this dataset as a template if you wish to have students collect their own data for this lab rather than using the student collected dataset from Pasadena City College.
Activity
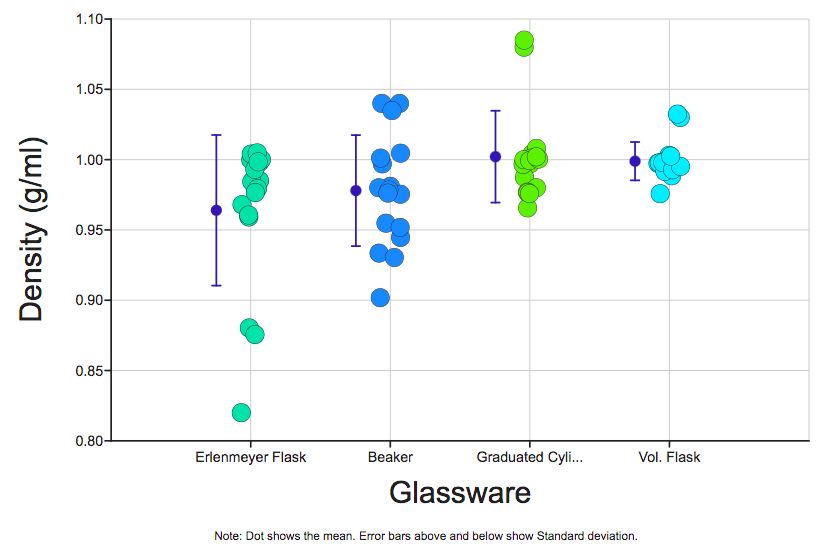
1. Make a graph showing the density calculations grouped by glassware type.
After opening the dataset, click on the Graph tab at the top of the screen to display the graph view. Be sure the Dot Plot icon is selected.
Use the X and Y buttons to the right of each variable to show the independent variable on the X-axis and the dependent variable on the graph’s Y-axis.

2. Next, you’ll add a visualization of the mean and standard deviation to your graph. Set the jitter to 1 to make each data point at least partly visible, then select the Descriptive Stats box. Be sure the line between Mean-Based and Standard Deviation displays in and the Notes box is checked.
3. Make a table that includes the values of the standard deviation of the measurements for each glassware type.
Under the Standard Deviation heading in the Descriptive Statistics section to the right of your graph, select the Values box. Use the camera icon on the table to copy and paste the table below.
You’ll notice that the note at the bottom of your graph refers to error bars and standard deviation. The standard deviation of a set of data points is the amount of variation among the points. Look at the data points associated with density values calculated from beaker measurements. You’ll see there’s a blue line with a dot just to the left of the data points. That blue dot is the mean, or average, of the data points. Do you see how there are data points both above and below the mean? Those data points contribute to the dataset’s variation. The blue lines that extend from the blue dot represent the amount of variation (aka standard deviation) of that set of data points. These are the error bars. Next, look at the data points that correspond to the volumetric flask. Notice how the data points cluster more closely around the mean. That means there’s less variation in those data points and thus a smaller standard deviation. Whenever you examine a graph with error bars, smaller error bars mean less variation in the data.

4. Use the standard deviation values in the table to rank the four glassware types from most precise to least precise. The standard deviation of a set of measurements generated by an instrument is a good representation of the precision of that instrument. The more variation present in a dataset generated from an instrument, the less precise that instrument is.
5. Use the percent error formula ((|experimental-theoretical|/|theoretical|) x 100) to determine the percent error of the mean calculated density of water for each glassware group. Locate the Mean column in the table. Don’t forget to use units throughout your calculations.
6. Using the percent error values you calculated above, rank the four different types of glassware from most accurate to least accurate. The amount of error generated by an instrument is a good representation of the accuracy of that instrument.