Trending Now
Exploring trends in the periodic table through graphing

Background
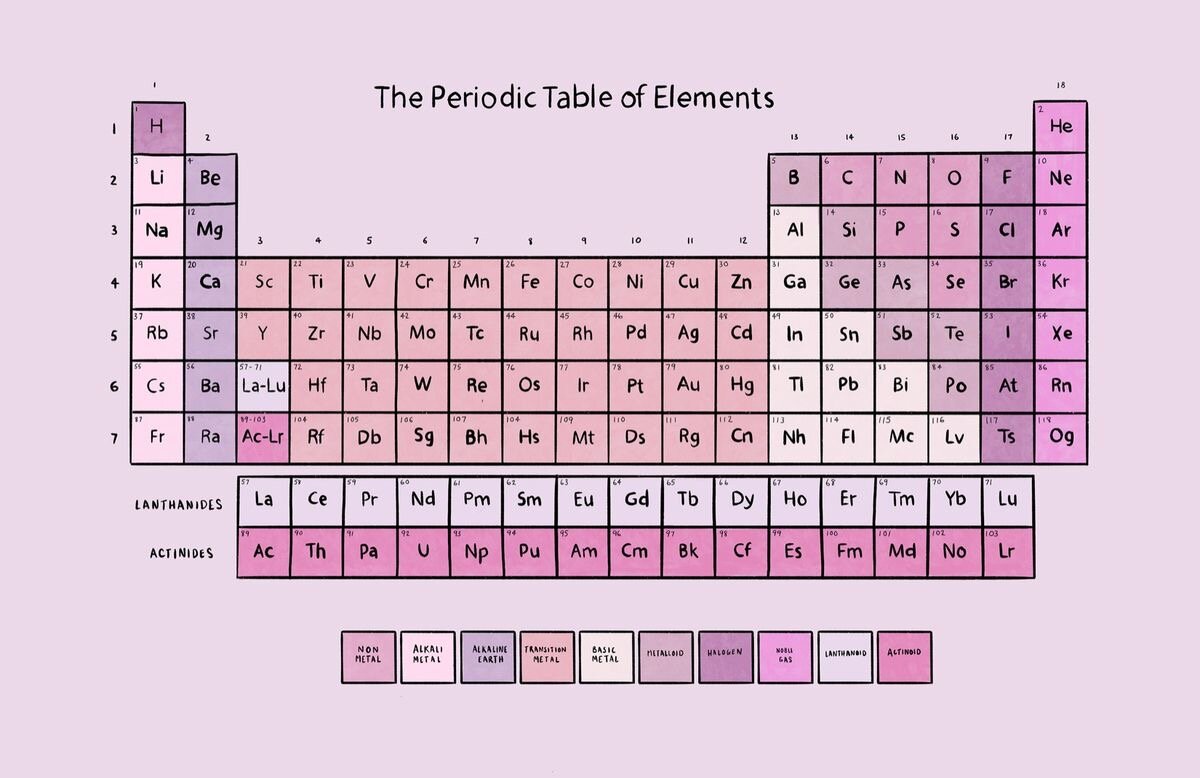
Why is the periodic table called the periodic table? Why isn’t it called the table of elements or the table of chemistry or something else? Sure, there are periods and groups in it, but what makes the entire table periodic, exactly?

When Dmitri Mendeleev and Lothar Meyer were each working on their own versions of a table of the elements in the mid-to-late 1800s, each scientist observed something interesting: There were certain patterns of physical and chemical properties that repeated over and over when the known elements were arranged by increasing atomic mass. These observations became what is now known as the periodic law. Mendeleev used the periodic law to leave empty spaces in his periodic table for elements he predicted would be discovered in the future. Mendeleev’s hypothesized elements were, in fact, discovered as the technical capabilities of chemistry and physics labs grew over time.
You will likely study several of the patterns derived from the periodic table in your chemistry class. These patterns include atomic radius, first ionization energy, electron affinity, chemical reactivity, and electronegativity. The definitions of these terms are as follows:
Atomic radius is the distance from the center of an atom’s nucleus to its outermost (valence) electrons. More specifically, the distance is between the center of the nucleus and the outermost orbital of valence electrons.
First ionization energy is the energy required to remove the most loosely held electron from an atom in the gaseous state. This quantity is typically measured per mole of atoms (with units kJ/mol). In this case, it is the energy required to remove the most loosely held electron from the valence shell of one mole of neutral gaseous atoms. This will produce one mole of gaseous ions, each with a charge of 1+.
Electron affinity is the amount of energy released when an electron is attached to a neutral atom or molecule in the gaseous state to form a negative ion. This is essentially the thermodynamic opposite of first ionization energy.
Chemical reactivity is the likelihood of a chemical substance to undergo a chemical reaction, either by itself or in combination with other substances.
Electronegativity is a measure of a particular atom’s tendency to attract shared electrons to itself when the atom is bonded to other atoms.
The Dataset
The dataset in this activity comes directly from the periodic table itself. In your analysis, you’ll examine graphic representations of two particular periodic trends - atomic radius and first ionization energy - and draw conclusions about these trends as they apply to the elements of the periodic table. Please note that in an effort to make the periodic trends as clear as possible, the dataset excludes elements in periods 6 and 7 and in groups 3-12 (the transition metals).
Variables:
Element Name - This categorical variable has values that are the names of the elements.
Atomic Number - This numeric variable represents the number of protons found in the nucleus of every atom of that element.
Group - This categorical variable indicates which of the numbered groups an element belongs to. Elements in the same group have similar properties.
Atomic Radius (pm) - This numeric variable is the distance from the center of an atom’s nucleus to its outermost (valence) electrons. This variable is measured in picometers.
First Ionization Energy (kJ/mol) - This numeric variable is a measure of the energy required to remove the most loosely held electron from an atom in the gaseous state. This quantity is typically measured per mole of atoms (with units kJ/mol).
The Activity
Part 1: Atomic Radius
1. Before examining the graph, make a prediction about what you expect to happen to the size (atomic radius) of atoms of each element as you progress from left to right across a period on the periodic table. Justify your prediction here:
2. Use your prediction to make a sketch of how you expect a graph to appear if you plot the atomic number on the x-axis and the atomic radius (size of the atom) on the y-axis.

3. Make a graph showing Atomic Radius (pm) on the Y-axis and Atomic Number on the X-axis .
Once the dataset is open, click on the Graph tab at the top of the screen to switch to graph view. Be sure that the Scatter/Box/Bar or Categorical Bubble icon is selected. Click the Show buttons beneath Atomic Number and Atomic Radius. Use the panel to the right side of the graph to plot Atomic Number on the x-axis and Atomic Radius on the y-axis. Finally, check the Connect Dots box. Use the camera icon in the upper right of the graph to copy your graph and paste it into your work document here:
4. Compare your prediction sketch and the graph of actual data you just created. Record any similarities and differences.

5. Next, click on the Table tab to go back to the data table. Click on the boxes in the Excluded column (all the way to the right) for all elements except those with atomic numbers 3-36.
6. How many periods from the periodic table are represented in the new graph you just created?
7. What do you notice about the magnitude of atomic radius as you move from left to right across each period in the graph?
8. Explain why the trend you described in question 7 exists. Consider the quantities of subatomic particles in an atom of each element you’re comparing.
9. Make a graph just showing Groups 1 and 2 (excluding Hydrogen).

Click on the Table tab to go back to the data table. Click on the boxes in the Excluded column (all the way to the right) for all elements except those in Groups I and II. You can highlight many rows at once to exclude all by clicking a single exclude checkbox.
Add Group as your Z variable so that the connect the dots function shows a connecting line for each group.
Paste your newly edited graph below:
10. What do you notice about the magnitude of atomic radius as you move down each of the two groups shown in the graph?
11. Explain why the trend you described in question 10 exists. Consider the quantities of subatomic particles in an atom of each element you’re comparing.
Part 2: First Ionization Energy
12. Before creating your next graph, make a prediction about what you expect to happen to the first ionization energy of atoms of each element as you progress from left to right across a period on the periodic table. Justify your prediction.
13. Use your prediction to make a sketch of how you expect a graph to appear if you plot the atomic number on the x-axis and the atomic radius (size of the atom) on the y-axis.
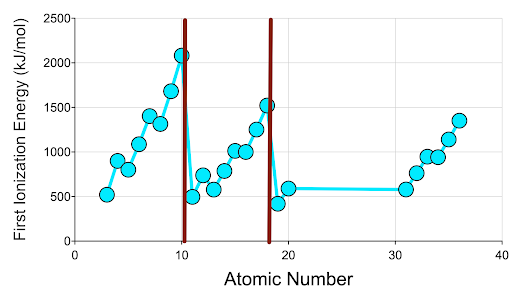
14. Make a graph showing First Ionization Energy on the Y-axis and Atomic Number on the X-axis.
Be sure to return to the Table tab to uncheck all the boxes in the Excluded column in order to display all the data. Click the Show button beneath First Ionization Energy. Use the panel to the right side of the graph to plot Atomic Number on the x-axis and First Ionization Energy on the y-axis. Be sure each variable is showing on the correct axis. Check the Connect Dots box. Paste it into your work document:

15. Record any similarities and differences between your prediction sketch and the graph of actual data you just created.
16. Next, click on the Table tab to go back to the data table. Click on the boxes in the Excluded column (all the way to the right) for all elements except those with atomic numbers 3-36.
17. What do you notice about the magnitude of atomic radius as you move from left to right across each period in the graph?
18. Explain why the trend you described in question 7 exists. Consider the quantities of subatomic particles in an atom of each element you’re comparing.
19. Make a graph just showing First Ionization Energy plotted on Atomic Number for just Groups 1 and 2 (excluding Hydrogen). Click on the Table tab to go back to the data table. Click on the boxes in the Excluded column (all the way to the right) for all elements except those in Groups I and II. You can highlight many rows at once to exclude all by clicking a single exclude checkbox.
Add Group as your Z variable so that the connect the dots function shows a connecting line for each group. Paste in your newly edited graph:

20. What do you notice about the magnitude of first ionization energy as you move down each of the two groups shown in the graph?
21. Explain why the trend you described in question 20 exists. Consider the quantities of subatomic particles in an atom of each element you’re comparing.