Mass extinctions past...and present?

Background
Evidence overwhelmingly points to mass extinction events being a cyclical part of the history of life on earth. By using data from the fossil record scientists have been able to estimate the rate at which species have gone extinct over the last 550 million years on our planet. It is through this kind of work that we have learned about mass extinction events.
Take a look at the table and dataset in this activity. Follow the instructions in the activity to build a graph from the dataset. You will then use information from these two sources to draw conclusions about the history of mass extinctions on earth as well as to make predictions about a present or future mass extinction event.
Table
Use this table together with the dataset and graph that you will make to answer questions about the history and future of mass extinction events on earth.
The big 5 mass extinction events:
| Extinction Event | t Age (Mya) | Species Lost (%) | Genera Lost (%) | Families Lost (%) | Suspected Causes |
|---|---|---|---|---|---|
| End Ordovician | 444 | 86 | 57 | 27 | change in sea level, ocean chemistry, atmospheric chemistry |
| Late Devonian | 360 | 75 | 35 | 19 | climate change, ocean oxygen levels |
| End Permian | 250 | 96 | 56 | 57 | ocean chemistry, atmospheric chemistry, climate change, change in sea level, volcanic activity |
| End Triassic | 200 | 80 | 47 | 23 | ocean chemistry, atmospheric chemistry, climate change, volcanic activity |
| End Cretaceous | 65 | 76 | 40 | 17 | ocean chemistry, climate change, atmospheric chemistry, change in sea level, volcanic activity, asteroid impact |
This table was constructed using information presented on Our World in Data as well as the University of California’s Understanding Evolution website.
Dataset
This dataset was created by drawing on an infographic from Our World in Data. That infographic used information from two primary sources; Has the earth’s 6th mass extinction event already arrived? and Vertebrate biodiversity losses point to a sixth mass extinction.
Variables
Millions of years ago (Mya) - This numeric variable represents time and is expressed in units of millions of years ago.
Extinction Rate (families per million yrs) - This numeric variable is the rate of extinction as measured in the number of taxonomic families recorded as extinct per million years.
Activity
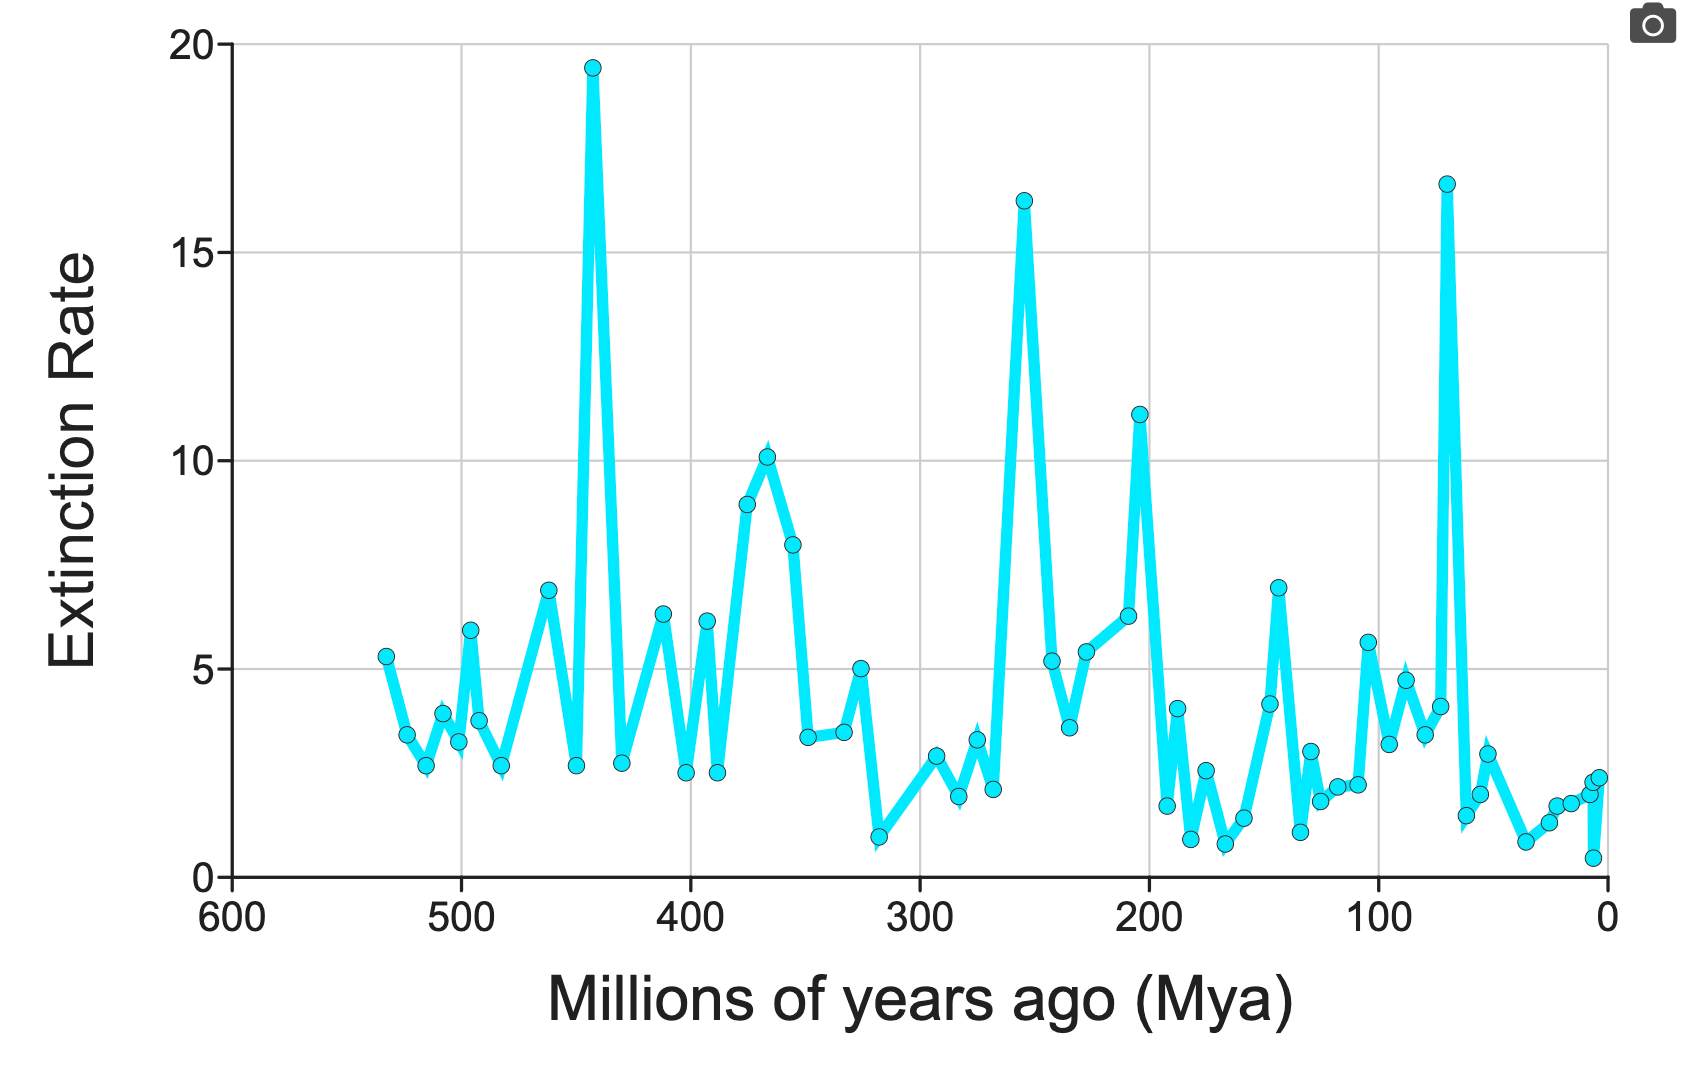
1) Make a graph showing the change in estimated extinction rate over time. Show Millions of years ago (Mya) on the X-axis and show Extinction Rate (families per million yrs) on the Y-axis. Connect the dots to make a line graph by checking the box at the right. You may reverse the direction of the X-axis if you wish.
2) Compare the table to your graph to find each of the big five mass extinction events on the graph. List the extinction rate for each of the big five mass extinction events.
3) Based on your response to #2, what would you say is the minimum extinction rate that is likely to trigger a mass extinction?
4) On the scale of geologic time, would you say that there is a slow build up to mass extinction or that such events have occurred rather suddenly? Explain how the shape of your line graph is evidence for your answer.
5) It is estimated that over 99% of all species that have existed on earth have gone extinct at some point in earth’s history. Ongoing extinction is a fact. However, some estimates of the current extinction rate estimate that species are now going extinct at a rate that is 10 to 1000 times faster than typical extinction rate on earth (which excludes the big five mass extinctions). What data needs to be collected to know the ongoing likelihood of the earth facing a mass extinction event in the near future?