Fun with Friction
Analyze stacked graphs with changing acceleration
Investigate how friction affects motion through stacked graphs in this shuffleboard scenario.
Background
A lot of money has been made around taking something we see as normal and making it miniature. The toy Hotwheels cars and Mini-Brands toys are just two examples of how simply shrinking something down and making a miniature toy version (from the size we are used to) draws people in.
Your friend proposes a new idea for a game: a mini shuffle board game that fits on a typical tabletop. Shuffleboard is a classic game where players slide weighted discs down a narrow court, with the goal of having them come to rest within a marked scoring area. Slide them too softly and they don’t go far enough; no points. Slide them with too much force and they slide clear off the end of the court; also no points.
Your friend says she will cut out all the materials for the mini shuffleboard court if you can decide how to finish off the surface where the discs will slide. Even though it’s a smaller scale version of something that already exists, you realize that the materials still need to be tested to make sure they will work at this new size. The two best choices are seal it and make it shiny like the large version, or be a bit lazy about this idea and just keep the wood exposed and raw (no finish on it). You know your friend will be asking about your decision, so you need to investigate how the discs she created for the board will work with the two possible playing surfaces.
The data below represents a disc being slid across two different surfaces towards a motion detector (which takes the data). Each time, you slide the disc with your finger a short way and then let go, allowing the surface friction to slow the disc down before reaching the end of the tabletop.
The two big questions:
Which disc will allow for more interesting gameplay (faster, further)?
Did you conduct a “good” experiment, and feel confident in the data you took?
Dataset
Variables
Time - This numeric variable describes the moment in time that data was taken, every 0.05 seconds. Zero is when data collection began. Measured in seconds.
Position - This numeric variable describes vertical height (not any horizontal movement). The value of zero represents the ground. Measured in meters.
Velocity - This numeric variable describes the speed and direction the object was moving. Measured in meters per second.
Acceleration - This numeric variable describes the change in velocity over time, as well as the direction of that change. Measured in meters per second per second.
Material - This categorical variable describes which type of surface material the plastic disc is being slid on. One trial was on raw wood, the second trial on sealed wood.
Disc Motion - This categorical variable describes what is physically happening to each disc. “RW” stands for raw wood and “SW” stands for sealed wood.
Activity
Make a graph of Position on the x-axis and Time on the y-axis. Select Object for the z-axis and paste your graph below:

2. What story can we tell from this graph about the person pushing the disc, and the two surfaces themselves? If you can, talk as specifically as you can (for example: what time periods is the disc being pushed? Where are the discs stopping? Make any comparisons you can between the two disc’s journeys).
3. Set the range of your X axis to zoom into just the points where the discs are moving. Leave this axis range set for all your following graphs, and will not be changed. Allow the y-axis to be auto for each graph. Paste your new graph here:

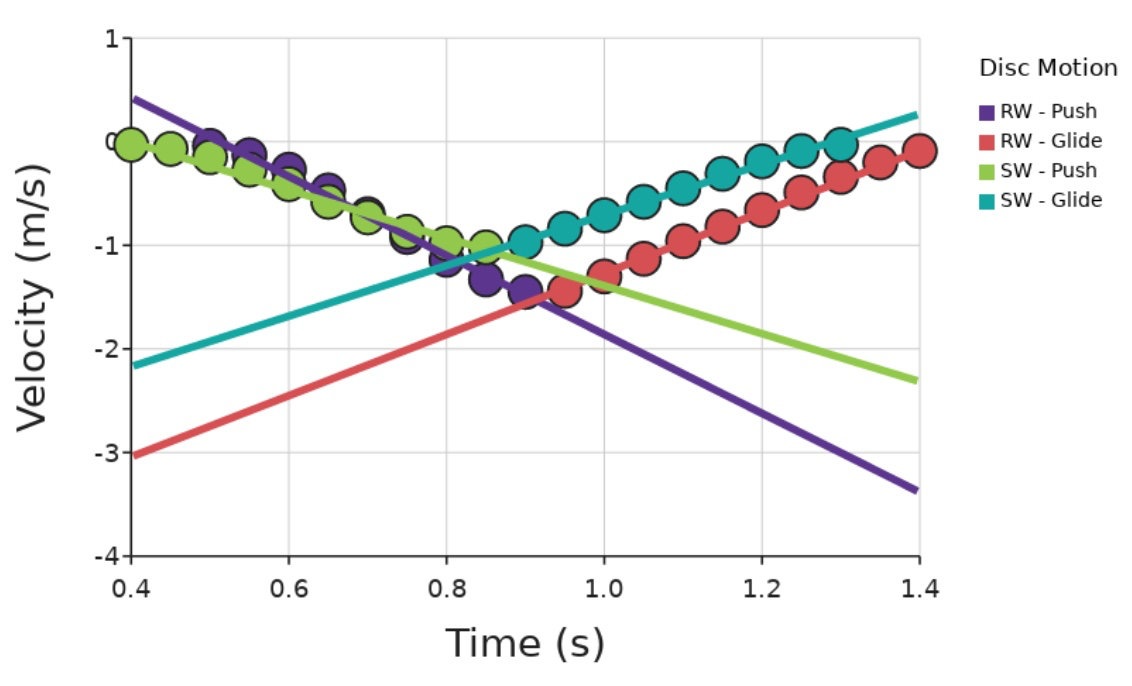
4. Make a graph of velocity vs. time (keeping the excluded points from previously, and not changing the range of your X axis)

5. What are the two main parts of this graph? What is happening to the discs on each surface during these moments?

6. Which disc is slowing down at a faster rate? What evidence do you see in your graph?
7. Select Disc Motion as your new z-axis variable, and add regression line. Click Group by Z. Paste your new graph below:
8. What are the values for slope for each of the equations? Include units (based on our variables) if possible.
This value of slope is describing: ________________
9. Make a graph of acceleration vs. time (keeping the excluded points from previously, and not changing the range of your X axis) . Remove any regression lines trying to form on your graph. Put object as your z-axis variable once again.

Final Findings:
10. Time to create some stacked graphs for a really good look at what’s happening.
Copy/Paste your graph from #3 (position), #4 (velocity), and #7 (acceleration) below :
Note: Resize the images after pasting in below so the x axis all lines up

11. Fill in the following chart to summarize what is physically happening:

12. Which disc will allow for more interesting gameplay (faster, further)?
13. Is this a good experiment? Does it do a good job creating a scenario where the only difference between the trials is the surface material (the independent variable)? Provide evidence for “yes!” or “nope!” using the three stacked graphs.
14. Find the coefficient of friction for each of the surfaces. Remember the disc is .2 kg in weight. (Hint: which acceleration value for each surface reflects the force of friction?)