Cash on the Cob
Is there a simple way that sweet corn growers can make more money?
Background
The production of field corn, the kind of corn used to feed livestock make products such as cornmeal, corn oil, and corn syrup, has improved dramatically over the past 50 years. Modern farms now produce more than three times as much field corn per acre than the farms of 50 years ago did. Much of this improvement in the production of field corn has come from breeding corn for an increased tolerance to higher densities of plants within a field. Field corn on modern farms is planted at a much higher density than it was a half-century ago. While this has led to those dramatic gains in field corn production, the same dramatic increase in yield has not been seen for sweet corn, the kind of corn that is eaten on the cob or processed for canning or freezing.
The production of sweet corn is big business. In 2021 the value of sweet corn grown in the US was $775 million dollars. However, recent research suggests that sweetcorn growers may be able to get higher production from their fields and make greater profit margins. Specifically for processing sweet corn, hybrids that are tolerant to crowding stress have been developed. However, there is evidence to suggest that these crowding stress tolerant (CST) hybrids may be underused by the growers of processing sweet corn.
Is there a simple action that growers of processing sweet corn could take to improve profit margins?
Dataset
This dataset was collected by researchers who grew CST hybrid corn with a variety of different plant density treatments under variable conditions on actual farms where processing sweet corn is grown. The researchers used a “randomized complete block design with two replicates (at each site)”. The ten density treatments were 42,000, 49,000, 57,000, 64,000, 72,000, 79,000, 86,000, 94,000, 101,000 and 109,000 plants per hectare, but actual densities were observed in the fields and reported in the dataset. The total size of each experimental plot varied across fields due to practical constraints of available space and planting equipment. All of the corn was grown with 76 cm between rows and density was manipulated by changing the space between plants in a row.
Profit margin was calculated as the value of cases of sweet corn produced per hectare minus the cost of seed and production.
For a full treatment of the methods you can access the original research paper published in the journal PLOS ONE.
Each row in the dataset contains a single year’s observations for a single plot in the study. Each column contains the values for a single variable.
Variables
The variables should be explained and defined very clearly so that logical conclusions and interpretations can follow from analysis.
site-year-plot # - This variable has been coded as information and will not be used in analysis for this activity. This is the ID number that indicates the study site, year, and number for an individual plot in the study. It is included only as information here.
Year - This variable has been coded as a categorical variable with five possible values (2013, 2014, 2015, 2016, 2017) It indicates which year an observation was recorded for. It may be coded as numeric for some analyses if you wish to change the Type of this variable.
State - This categorical variable indicates the state where the corn was grown. Actual Plant Density (plants/ha) - This numeric variable is an estimate of the density of plants in the field based on standardized observation at the field. It is recorded in units of plants per hectare.
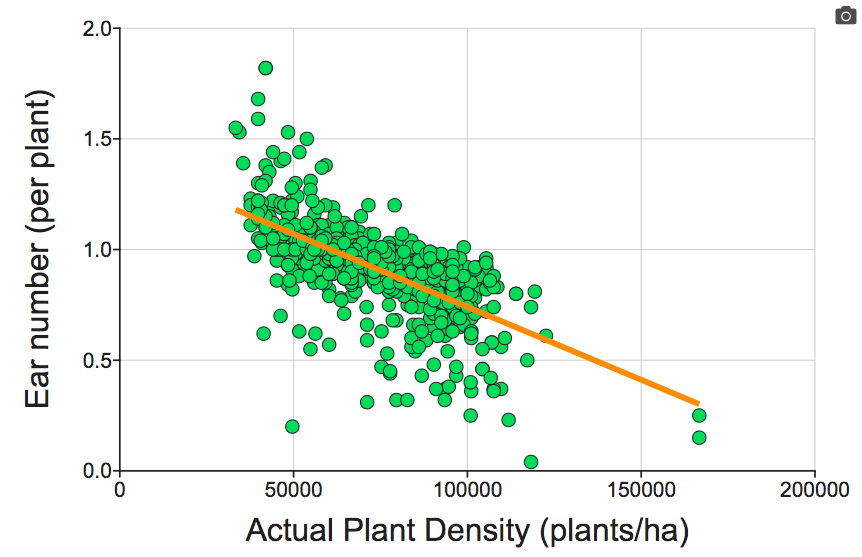
Ear number (per plant) - This numeric variable is the average number of ears of corn per plant for this site-year-plot.
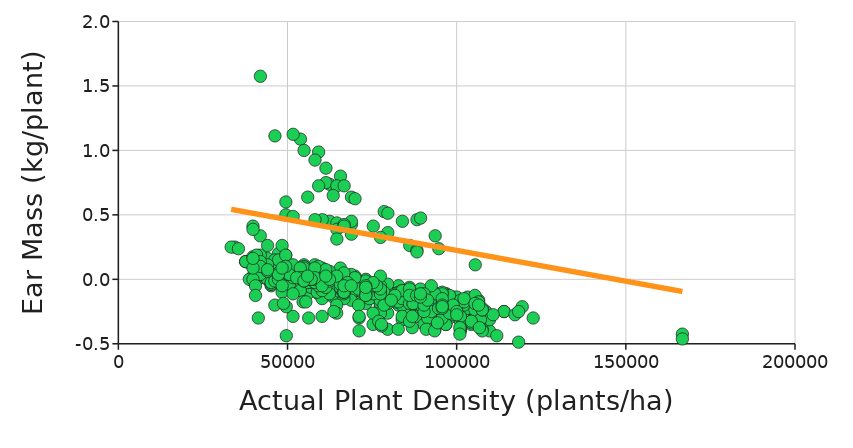
Ear Mass (kg/plant) - This numeric variable represents the average mass of a single ear of corn in a site-year-plot. It is recorded in units of kg/plant.

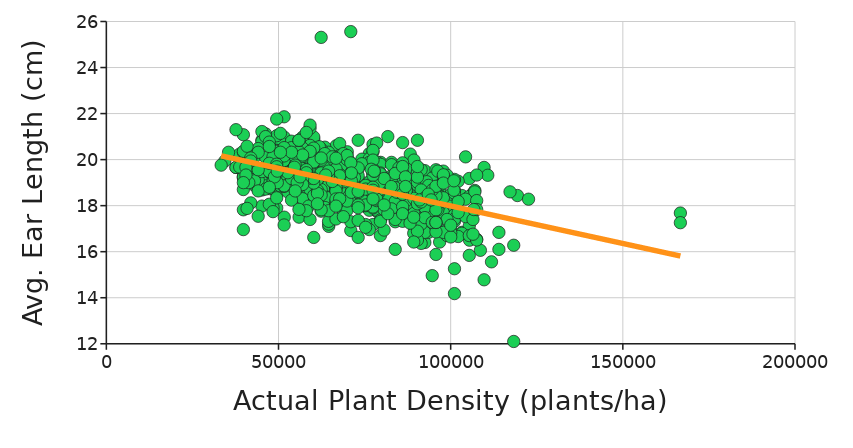
Avg. Ear Length (cm) - This numeric variable is the average ear length (in centimeters) of an ear of corn within a given site-year-plot.
Avg. Filled Ear Length (cm) - This numeric variable is the average length of the ear that is actually filled with kernels. Measured in centimeters.
Kernel Mass Per Plant(g/plant) - This numeric variable is the average per plant mass of corn kernels. Measured in units of grams per plant.
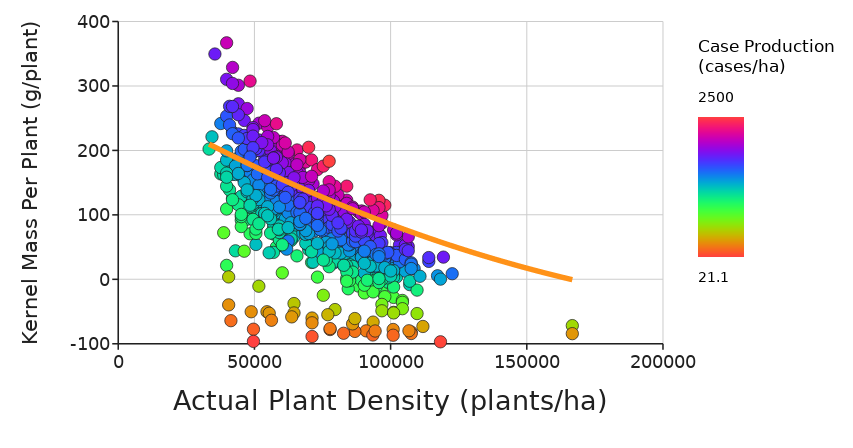
Case Production (cases/ha) - This numeric variable records the average number of cases of processed corn that was produced per hectare of land. This is an overall measure of sweet corn production in a field. 6.13 kg of kernels.
Seed Cost($/ha) - This numeric variable is the cost of seed needed to plant at the density. Based on a cost of $4.22 per 1,000 seed kernels.
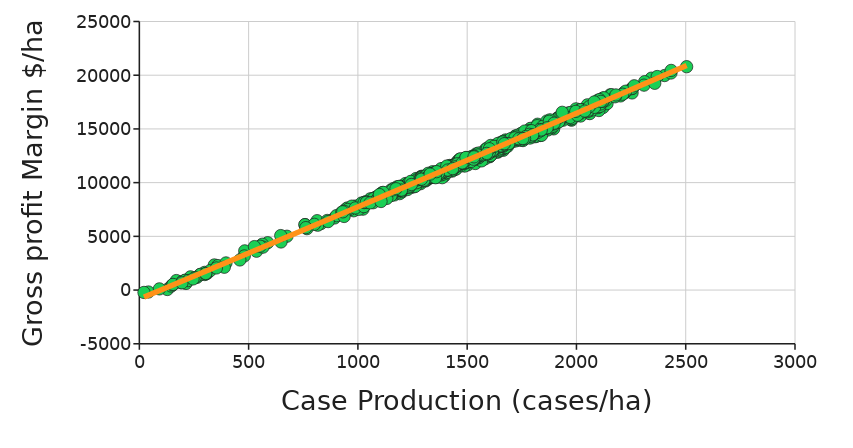
Gross profit Margin ($/ha) - This numeric variable represents the total profit from each hectare of land after accounting for cost of seed ($4.22 per 1,000 kernels) and production ($82 as a fixed amount paid per unit metric ton of green ear mass harvested). It is expressed in US dollars per hectare.
Activity
Get to know the data
What effect does the density of plants in a cornfield have on the growth of corn on an individual plant?
To answer this question explore the data by making and interpreting a series of graphs with Actual Plant Density (plants/ha) on the X-axis and the ear traits (Ear Number, Ear Mass, Ear Length, Filled Ear Length, Kernel Mass Per Plant) on the y-axis. Add a regression line to help visualize the trends.

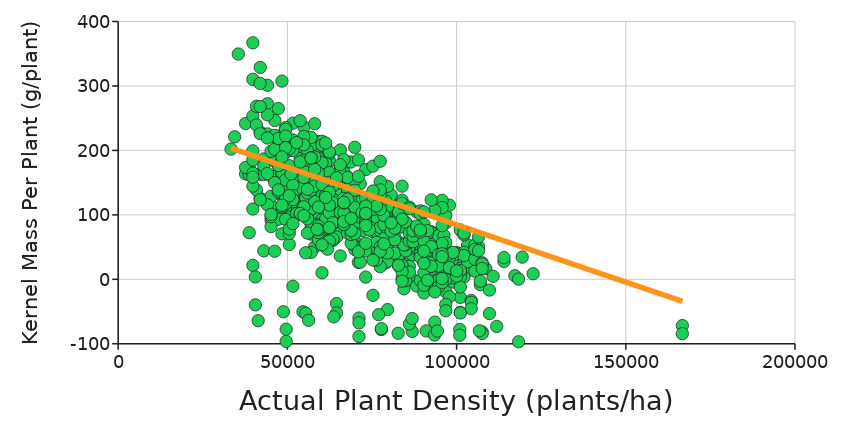
Choose the three graphs (of the five total) that you think provide the strongest evidence to support your answer for question #1 above. Copy and paste your graphs below:
2. Does the production level ofthe individual corn plant determine the overall production of corn by the field? When looking at the graph of Kernal Mass Per Plant on Plant Density in the field, where is the area of greatest Case Production?
To answer this question try plotting Kernel Mass Per Plant on the Y-axis, and Actual Plant Density (plants/ha) on the X-axis. Now show Case Production (cases/ha) on this graph by making it the Z-variable on the control panel.
3. What is the relationship between overall production ofthe cornfield and the profit made by sweet corn growers? Paste a graph below as evidence for your answer:
To answer this question make a graph with Case Production (cases/ha) on the X-axis and Gross profit Margin $/ha on the Y-axis.
4. Make a model to show what level of density in a cornfield would predict the greatest profit margin for a sweet corn grower.
To answer this question, build a scatter plot with a quadratic regression line visible. This will allow the predicted level of profit margin to take on a curve shape over the observed values of Case Production in the dataset.
Show Actual Plant Density (plants/ha) on the X-axis and Gross profit Margin ($/ha) on the Y-axis. Show Case Production (cases /ha) on z-axis. Add a regression line and choose the Quadratic option from the drop down menu.

5. According to the model you made in #4, whatlevel of plant density in the cornfield is predicted to result in the most profit for sweetcorn growers?
To answer this question, take your mouse or trackpad and trace the quadratic regression line that is showing on top of the data points. Remember, the quadratic line of best fit is the model prediction for profit at a given level of density. What is the value of X that produces the highest value of Y?
6. The average density that growers are currently planting sweetcorn is around 58,475 plants/ha. How much more money per hectare would you expect farmers to make on average if they planted according to what this model predicts?
Reference to Original Paper: Dhaliwal, Daljeet S., and Martin M. Williams. "Optimum plant density for crowding stress tolerant processing sweet corn." PloS one 14.9 (2019): e0223107.
Coauthor Christine Girtain is the Director of Authentic Science Research at Toms River Regional Schools, in Toms River New Jersey. She is a Nourish the Future Teacher Leader and was the New Jersey STEM Pathways Network 2019 STEM Teacher of the Year.
We wish to thank Dr. Daljeet Dhaliwal of the University of Illinois and Semios BIO Technologies Inc for taking the time to speak with us about this study.