Birds of Hubbard Brook (part 2) - Bye Bye Birdie

*This is a modified version of the original Data Nugget that has been designed to be used on the DataClassroom web-app. The original pencil and paper activity can be found here on the Data Nuggets website.
Featured scientist: Richard Holmes from the Hubbard Brook Experimental Forest
Background
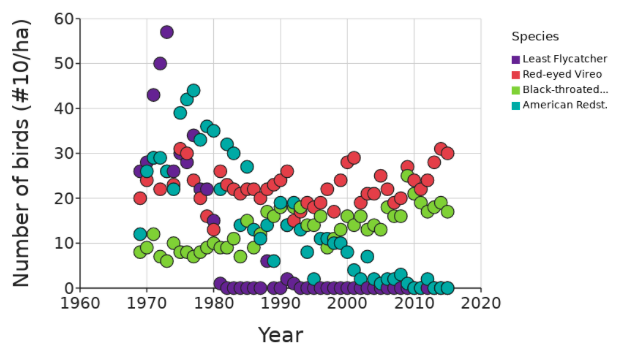
In Part I, you examined patterns of total bird abundance at Hubbard Brook Experimental Forest. These data showed bird numbers at Hubbard Brook have declined since 1969. Is this true for every species of bird? You will now examine data for four species of birds to see if each of these species follows the same trend.
It is very hard to study migratory birds because they are at Hubbard Brook only during their breeding season (summer in the Northern Hemisphere). They spend the rest of their time in the southeastern United States, the Caribbean or South America or migrating between their two homes. Therefore, it can be difficult to tease out the many variables affecting bird populations over their entire range. To start, scientists decided to focus on what they could study—the habitat types at Hubbard Brook and how they might affect bird populations.

Hubbard Brook Forest was heavily logged and disturbed in the early 1900s. Trees were cut down to make wood products, like paper and housing materials. Logging ended in 1915, and various plants began to grow back. The area went through what is called secondary succession, which refers to the naturally occurring changes in forest structure that happen as a forest recovers after it was cut down or otherwise disturbed. Today, the forest has grown back. Scientists know that as the forest grew older, its structure changed: Trees grew taller, the types of trees changed, and there was less shrubby understory. The forest now contains a mixture of deciduous trees that lose their leaves in the winter (about 80–90%; mostly beech, maples, and birches) and evergreen trees, mostly conifers, that stay green all year (about 10–20%; mostly hemlock, spruce, and fir).
Richard and his fellow scientists already knew a lot about the birds that live in the forest. For example, some bird species prefer habitats found in younger forests, while others prefer habitats found in older forests. They decided to look carefully into the habitat preferences of four important species of birds—Least Flycatcher, Red-eyed Vireo, Black-throated Green Warbler, and American Redstart—and compare them to habitats available at each stage of succession. They wondered if habitat preference of a bird species is associated with any change in the bird populations at Hubbard Brook since the beginning of succession.
Least Flycatcher: The Least Flycatcher prefers to live in semi-open, mid-successional forests. The term mid-successional refers to forests that are still growing back after a disturbance. These forests usually consist of trees that are all about the same age and have a thick canopy at the top with few gaps, a relatively open area under the canopy, and a denser shrub layer close to the ground.
Red-eyed Vireo: The Red-eyed Vireo breeds in deciduous forests as well as forests that are mixed with deciduous and coniferous trees. They are abundant deep in the center of a forest. They avoid areas where trees have been cut or blown down and do not live near the edge. After an area is logged, it often takes a very long time for this species to return
Black-throated Green Warbler: The Black-throated Green Warbler occupies a wide variety of habitats. It seems to prefer areas where deciduous and coniferous forests meet and can be found in both forest types. It avoids disturbed areas and forests that are just beginning succession. This species prefers both mid-successional and mature forests.
American Redstart: The American Redstart generally prefers moist, deciduous, forests with many shrubs. Like the Least Flycatcher, this species prefers mid-successional forests.
Hypothesis:
Find the hypothesis in the Research Background and copy/paste it below. A hypothesis is a proposed explanation for an observation, which can then be tested with experimentation or other types of studies.
Draw your predictions: Below is a diagram of secondary succession at Hubbard Brook where you can draw your predictions. Think about the different habitat preferences of the four bird species. Double click on the image to make changes to it.
Scientific Data:
3. What data will you graph to answer the question?
Independent variable(s):
Dependent variable(s):
4. Create your graph, and set Species as z-axis variable. Paste your graph below:
5. To really observe the trend, connect the dots of your graph, and click hide dots. Refer to your graph as evidence in your answer. Paste your new graph below:

6. Identify any changes, trends, or differences you see in your graph. Include your graph and specifically refer to it when describing those changes, trends, or differences. Write a sentence for each trend.
Interpret the Data:
7. Make a claim that answers the scientific question.
8. What evidence was used to write your claim? Reference specific parts of the tables or graph.
9. Explain your reasoning and how the data support your claim. Connect your reasoning to what you learned about the habitat preferences of each bird species and how habitats change through forest succession.
10. Did the data support Richard’s hypothesis? Use evidence to explain why or why not. If you feel the data were inconclusive, explain why.
Want an Answer Key? Fill out the form below.
This dataset and content is provided our by our friends at Data Nuggets.
Visit DataNuggets.org to see the original activity and additional materials
