Driving while Black or Brown: Exploring institutional racism through the lens of data
“In a racist society, it is not enough to be non-racist, we must be anti-racist.”
- Angela Y. Davis
Eric Carlson and I first met in 2008 when we were both teaching at Thomas Kelly High School on Chicago’s Southwest Side. His classes were known throughout the building for actively fostering a sense of social justice and promoting activism. We have collaborated here to create what we hope is an effective anti-racist lesson plan for teachers of the humanities that is built around a dataset. We also hope that this will be used by science and math teachers to show that collecting and analyzing data is a technique to explore real world issues and help solve problems far beyond the sciences. Acknowledging institutional racism through data can be particularly powerful for young people because data have the power to validate or challenge student perceptions of the world.
-Aaron Reedy
CEO DataClassroom

Lesson
Lesson Objective Questions:
Students should improve their ability to answer these questions by the end of the lesson.
What is institutional racism (also referred to as “systemic racism” and “structural racism?)” and how is it affecting individuals and communities in the context of traffic enforcement?
How can data recorded during traffic stops in the state of Missouri that includes racial information about those being stopped help us to understand the extent to which institutional racism is evident in traffic enforcement practices in that state and beyond?
Homework or Bell-Ringer (10 minutes):
Is it possible for a society to promote racism, even if no one in that society is consciously engaging in racist behavior? Why or why not?
Introduction:
Short Video and Discussion (15-20 minutes):
Although the issue of racial profiling in policing has helped give rise to the Black Lives Matter movement, racial profiling has been detrimental to Black and Brown people in the United States since even before there were organized police departments (1). In 1998, the US House of Representatives unanimously passed the Traffic Stops Statistics Act in attempt address widespread racial profiling by police departments around the country. This legislation gave rise to many individual state efforts to record the kind of data that can reveal racial profiling on a large scale (2).
Have your class watch The Ever-Present Anxiety of Black Motorists (7:38) by National Geographic. In the video, Black and Brown individuals describe their experiences with police during traffic enforcement. Reflect on the video and discuss the following with your class before you view the dataset and activity.
Afterwards, discuss:
What is your initial response to the video?
The use of data has been recently touted as a way to improve policing. Would you expect the pattern of racial bias in traffic stops described in this video to show up in data collected by police departments on their traffic enforcement? If so, what patterns might you expect to see in data that contained information about the races of individuals stopped by police, search rates, and arrest rates?
Additional/Optional Introduction Video:
Sandra Bland Traffic Stop
On July 10, 2015, Sandra Bland, an African-American woman from the Chicago area, was pulled over by a state trooper in Waller County, Texas, for failing to signal a lane change. A dashboard camera video of the incident released by Texas officials depicted the ensuing interaction between Bland and Trooper Brian T. Encinia (3).
While failing to use a turn signal is an arrestable offense in Texas, it rarely happens (4). Encinia’s actions during the incident were quickly condemned by state legislators, the director of the Texas Department of Public Safety, The American Civil Liberties Union, and others (5). Tragically, Bland was found hanged in a jail cell where she was being held three days later as a result of this traffic stop. Her death was ruled a suicide. Protests followed, with many claiming that law enforcement in the area is institutionally racist (6).
Watch the video (2:14) of Ms. Bland’s interaction with Trooper Encinia. Please, be aware that the footage of the video contains threats of violence and may be hard for some to watch.
What is your initial response to this video?
This traffic stop for a minor violation escalated very quickly. How can you explain this escalation from each of their perspectives?
Background (15 minutes):
Have you ever heard the term “institutional racism?” (synonyms include “systemic racism” and “structural racism”). Try to define the term before you go on.
Institutional Racism is defined by The University of North Carolina’s FPG Child Development Institute (7,8) as “distinguished from the explicit attitudes or racial bias of individuals by the existence of systematic policies or laws and practices that provide differential access to goods, services and opportunities of society by race. Institutional racism results in data showing racial gaps across every system. For children and families it affects where they live, the quality of the education they receive, their income, types of food they have access to, their exposure to pollutants, whether they have access to clean air, clean water or adequate medical treatment, and the types of interactions they have with the criminal justice system.”
NAACP president Derick Johnson defines systemic racism (9) more succinctly as "systems and structures that have procedures or processes that disadvantage African Americans."
Another highly relevant term to understanding this dataset is racial profiling, described by the American Civil Liberties Union as “the discriminatory practice by law enforcement officials of targeting individuals for suspicion of crime based on the individual's race, ethnicity, religion or national origin. Criminal profiling, generally, as practiced by police, is the reliance on a group of characteristics they believe to be associated with crime. Examples of racial profiling are the use of race to determine which drivers to stop for minor traffic violations (commonly referred to as "driving while black or brown"), or the use of race to determine which pedestrians to search for illegal contraband.” (10)
Note that the terms above generally focus on how systems, structures, policies and laws cause racist outcomes, as opposed to how individuals exhibit racist attitudes.
The Dataset:
This dataset was collected as a result of a law passed in Missouri out of concerns about racial profiling.
According to the office of the Missouri Attorney General, “Concerns by the citizens of Missouri and the Missouri legislature regarding allegations of bias in traffic enforcement prompted the passage of Section 590.650, RSMo. SB 1053 created Section 590.650, RSMo. which became effective August 28, 2000. This statute created the Vehicle Stops Report and required that the Attorney General’s Office collect and report on traffic stops conducted by law enforcement officers across the state of Missouri.” (11)
So what do years of data (2000-2018) collected as a result of this statute tell us about the extent to which Missouri traffic enforcement has demonstrated racial bias in terms of deciding which drivers to stop, search, and arrest? Let’s dig into the data to find out.
Variables
Year - The year the data were collected. Ranges from 2000 to 2018.
Race - Categorical variable collected with possible values of White, Black, Hispanic, Asian, American Indian, or Other.
Population - The total population of individuals identified by a particular race within Missouri. Note that this population data was not updated each year, but rather was based on census data for most years. The population data is not updated to reflect any changes in population beyond the 2010 census.
Statewide Population (%) - The percentage of the total population for a given racial group based on the latest census data used
Stops - The number of traffic stops made by police
Disparity Index - This summary metric relates each racial/ethnic group’s proportion of total traffic stops to its proportion of the driving-age (16+) population. It is calculated as (% of total traffic stops/ % of Missouri’s driving age population) A value of 1 indicates that a group’s proportion of vehicle stops equals its population proportion: it is neither "under-represented" nor "over-represented." Values above 1 indicate over-representation, and those below 1 indicate under-representation in traffic stops.
Searches - The number of searches conducted by police during traffic stops
Search Rate (%) - The number of searches divided by the number of stops (x 100). Searches include both searches of drivers and searches of the vehicle and property within.
Arrests -The number of arrests made as a result of a traffic stop
Arrest Rate (%) - The percentage of traffic stops that resulted in an arrest for any reason
Contraband Hit Rate (%) - The percentage of searches in which contraband is found
Data Activity (40 minutes)
Create a series of data visualizations to gain insights and answer the questions below.

1) Make a graph to compare the Search Rate (%) among the different groups represented in the dataset. If you are viewing the data table, first click the yellow Make a Graph button. You then add variables to the graph by clicking on the Show buttons located beneath the variable names listed towards the top of the screen. Show Search Rate (%) on the Y-axis and Race on the X-axis. The red X and Y buttons to the right of the graph display what you are currently showing on the plot. Click or unclick these buttons to make changes. Each data point represents data collected for a single year. Check the box that reads Descriptive stats to add representations of the mean Search Rate (%) for each racial group.
Analysis
2. How do the search rates for different races compare?
3. Which races are searched at the highest and lowest rates?
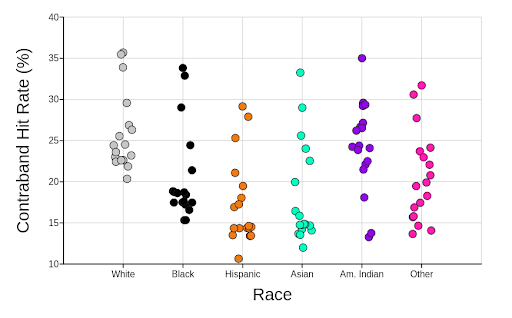
4. Make a new graph showing Contraband Hit Rate (%) on the Y-axis, but keep Race on the X-axis.
Analysis
5. The contraband hit rate represents the percentage of stops in which contraband (illegal materials) was found. How do the contraband hit rates for the different races compare?
6. Some may claim that it was reasonable for Missouri law enforcement to engage in racial profiling because certain races were more likely to be in possession of contraband. Do these data support or refute that claim?

7. Make a new type of graph showing Year on the X-axis, Search Rate (%) on the Y-axis, and add Race as your Z variable. When you see the check box called Connect dots appear to the right of the graph (just above the red X, Y, and Z), click it to make a line graph that shows change over time for each race in the dataset.
Analysis
8. How have the search rates changed over time? Do you notice similar or different trends between races?
9. To what extent does this data indicate that racial profiling in Missouri traffic stops changed between 2000 and 2018?

10. Now change the graph you made to answer the next two questions so that the Disparity Index is now shown on the Y-axis instead of the Search Rate (%).
Analysis
11. How do the different races compare in terms of the Disparity Index, and how have those disparities changed over time?
12. Based on this information, as well as what you have learned from the previous graphs, what conclusions can you draw about the degree to which institutional racism was evident in Missouri traffic enforcement between 2000 and 2018?
Conclusions:
13. Now that you have analyzed these data, does it affect your initial impression of the introductory video(s)? Why or why not?
14. Racial disparities in society affect all people in our society. What connections can you make between these data and your own lived experiences? Does making these connections make you uncomfortable? Why or why not?
Extension Activities:
Listen to this radio story from National Public Radio about how a Black woman was pulled over in Florida when her daughter removed the top half of her seatbelt in order to say hello to a police officer, resulting in over $1000 in fines and jeopardizing her ability to work. Then, discuss (15 minutes):
Can you think of other ways in which individuals or societies may suffer negative consequences from institutional racism in law enforcement or other sectors of society?
According to this report, traffic stops make up 20% of the budget for the city of Ferguson, Missouri. Hypothesize: how might policing practices be influenced by economic concerns?
Racial disparities in traffic stops are not unique to Missouri. The Stanford Open Policing Project has collected data from 21 state patrol agencies and 29 municipal police departments, finding significant racial disparities in policing, including evidence of bias. Dive into the data on their website.
Read this article by the ACLU to learn more about other forms of racial profiling relevant to law enforcement.
100 ways you can take action against racism right now. USA Today.
References
Hassett-Walker, Connie. “The racist roots of American policing: From slave patrols to traffic stops” The Conversation, 4 June 2019,
Harris, David A.. “Racial Profiling: Past, Present, and Future?” American Bar Association, 21 January, 2020,
Yancey-Bragg, N'dea. “What Is Systemic Racism? Here's What It Means and How You Can Help Dismantle It.” USA Today, Gannett Satellite Information Network, 19 June 2020,
usatoday.com/story/news/nation/2020/06/15/systemic-racism-what-does-mean/5343549002/
Lai, K.K. Rebecca, et al. “Assessing the Legality of Sandra Bland's Arrest.” The New York Times, The New York Times, 20 July 2015, www.nytimes.com/interactive/2015/07/20/us/sandra-bland-arrest-death-videos-maps.html
Montgomery, David. “Sandra Bland Was Threatened With Taser, Police Video Shows.” The New York Times, The New York Times Company, 21 July 2015, www.nytimes.com/2015/07/22/us/sandra-bland-was-combative-texas-arrest-report-says.html.
Dart, Tom. “'What Happened to Sandy?': Protesters Tie Sandra Bland Case to US Race Tensions.” The Guardian, Guardian News and Media, 18 July 2015, www.theguardian.com/us-news/2015/jul/17/sandra-bland-texas-protest-racial-tensions.
Lietz, M. (2018, February 13). Not That Kind of Racism: How Good People Can Be Racist Without Awareness or Intent. [Blog post]. Retrieved from https://www.egc.org/blog-2/2018/2/12/not-that-kind-of-racism
“What Racism Looks Like.” UNC Frank Porter Graham Child Development Institute, Frank Porter Graham Child Development Institute, fpg.unc.edu/sites/fpg.unc.edu/files/resources/other-resources/What%20Racism%20Looks%20Like.pdf.
Yancey-Bragg, N'dea. “What Is Systemic Racism? Here's What It Means and How You Can Help Dismantle It.” USA Today, Gannett Satellite Information Network, 19 June 2020, eu.usatoday.com/story/news/nation/2020/06/15/systemic-racism-what-does-mean/5343549002/.
“Racial Profiling: Definition.” American Civil Liberties Union, www.aclu.org/other/racial-profiling-definition.
“2018 Executive Summary.” Eric Schmitt Missouri Attorney General, ago.mo.gov/home/vehicle-stops-report/2018-executive-summary.
Acknowledgements
Valeria Escobedo M.Ed. is the English Department Chair at Western School of Science and Technology in Phoenix, Arizona and we thank her for her helpful comments on an early draft of this activity. You can reach her at msescobedotfa@gmail.com.
Alexis White works to reform American education through the creation of class disruptive systems and organizations. She helps White individuals to become better anti-racist allies through The Unweaving. She is currently an M.Ed student studying education policy at Harvard University. We thank her for her helpful comments on an early draft of this activity.
Author
Eric Carlson has taught Geography, Global Politics, Theory of Knowledge and other Humanities courses in four different countries over seventeen years. He is passionate about project-based, experiential and interdisciplinary learning with a focus on global citizenship, activism and social justice. Eric loves connecting his students with individuals or organizations doing interesting work in the world. Contact him with ideas about collaborating. carlsonteacher@gmail.com