Fish are what fish eat
See energy transfer in a food web through data.
This dataset gives your students a quantitative way to see trophic levels and the concept of energy transfer in an ecosystem. This dataset can also be used to compliment AP Biology Investigation 10.

Background
You are what you eat. Biologically speaking, that old saying is literally true. Living organisms, including you, are made up of the molecules and materials that once existed in your food (which was previously a collection of living organisms). Both organic molecules and energy move through a food web as consumers eat other organisms to acquire the energy needed to live, grow, and reproduce.
Energy transfer from one trophic level to the next is roughly 10% efficient. That is to say that when consumers feed on other organisms (whether plants or animals) only 10% of the energy from that trophic level gets incorporated into the consumer’s trophic level. Thus, each link in a food chain or web reduces the amount of energy available to the next. This is the reason why we find far fewer top predators in an ecosystem than we do producers or primary consumers.
Dataset
By studying what fish (and other consumers) are made of, we can determine what they eat and thus their position in the food web. A study conducted by scientists at Colorado State University utilized such an understanding in order to model the aquatic food web in Shasta Lake, California. The scientists knew that levels of nitrogen-15 isotopes increase at higher trophic levels as nitrogen is metabolized. Specifically a previous study had shown that nitrogen-15 isotopes increase by 3 to 4 parts per thousand (ppt) per trophic level.
The scientists collected tissue samples from a variety of organisms within the aquatic ecosystem of Lake Shasta. They then dried the tissue samples in an oven and ground the dried samples into a powder. These powdered samples were then measured for levels of nitrogen-15 isotopes using a device called a mass spectrometer.
Variables
Species: A categorical variable that names the species of organism sampled.
𝛅Nitrogen-15 (ppt): A numeric variable that indicates the level of nitrogen-15 isotope. The “𝛅” is the Greek letter delta, which is scientific shorthand for “difference.” This difference refers to the ratio of the nitrogen-15 isotope to the more common form of nitrogen with an atomic mass of 14.
Activity
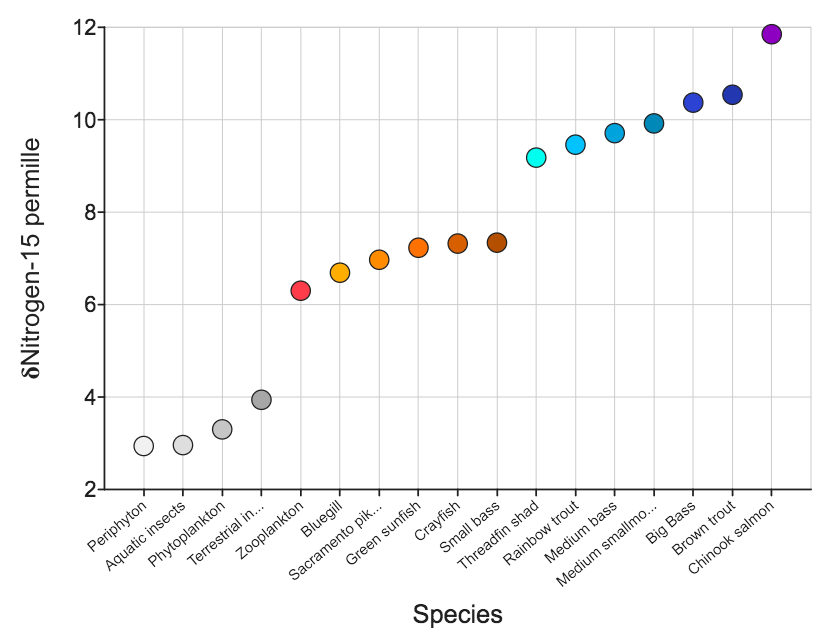
Use the Graph feature to visualize the data and the trend in nitrogen-15 content. Choose the scatter plot. Place the numeric variable 𝛅Nitrogen-15 (ppt) on the X-axis and the categorical variable Species on the Y-axis. The order of species on the X-axis have been sorted by mean values of 𝛅Nitrogen-15 (ppt).
Considering that nitrogen-15 isotopes are known to increase by 3 to 4 parts per thousand (ppt) per trophic level, when you look at the graph how many different trophic levels do you see in the data? Which species are in each trophic level that you see represented?
Biomagnification is the term used to describe the phenomenon of a chemical that exists in trace amounts in lower trophic levels becoming more concentrated in consumers in upper trophic levels. Describe how that principle is related to the data in this dataset.
One of the assumptions made by the scientists in this study is that bass have different diets at different ages. Their age corresponds to their size and were described as either small, medium, or large. Based on their relative nitrogen isotope concentrations, is there evidence to support the assumption that bass have diets that vary with age?