Diving into Energy Transformations
How does potential energy change to kinetic as a high diver dives off a cliff?
Background
High divers have been a part of fantastical shows for ages. Every few years the diving board seems to get higher and higher. Olympians have maxed out their competitive dives at 10 m, but there are plenty of others who compete at even higher heights. Check out this video of one olympic diver, Molly Carlson, diving out of a building at 20m high:
Check out the data below to investigate how the energy of a high diver changes as she falls through the air into the water below.
Note: This diver in this dataset is jumping in like a pencil (no rotation) and we are assuming there is negligible air resistance.
Dataset
Variables
Time (s) - This numeric variable describes the amount of time since the moment the cliff diver leaves the platform. Measured in seconds.
Energy (J) - This numeric variable describes the amount of energy held by the diver. Measured in joules.
Type of Energy - This categorical variable describes what is being measured. Values include Potential Energy, Kinetic Energy, and Total Energy (Potential + Kinetic).
Activity
Make a graph of time on the x-axis and Energy on the y-axis. Paste your graph below:

2) Describe what you are seeing in this graph. Each of these lines represents either potential energy (PE), kinetic energy (KE), or total energy (TE) of the diver. Which line shows potential energy as the diver falls off the cliff? Which might be KE and TE?
3) Add Type of Energy as your z-axis. Screenshot your graph below:

How do these categories align with your predictions in #2?
4) Select Regression Line and Group by Z. What type of equation fits this data best? List the type below (ex: linear, quadratic, cubic, etc)

5) Below is the distance vs. time graph for this cliff dive:

Which type of energy (from graph #3) does this graph look most like?
6) Why would your answer to #5 and height be related? Use your understanding of energy equations as evidence.
Extension: How do these graph shapes relate to your understanding of stacked graphs (distance vs. time → velocity vs. time → acceleration vs. time)? (Hint: acceleration is constant at 9.81 m/s/s)
7) Below is the velocity vs time graph of the cliff dive:
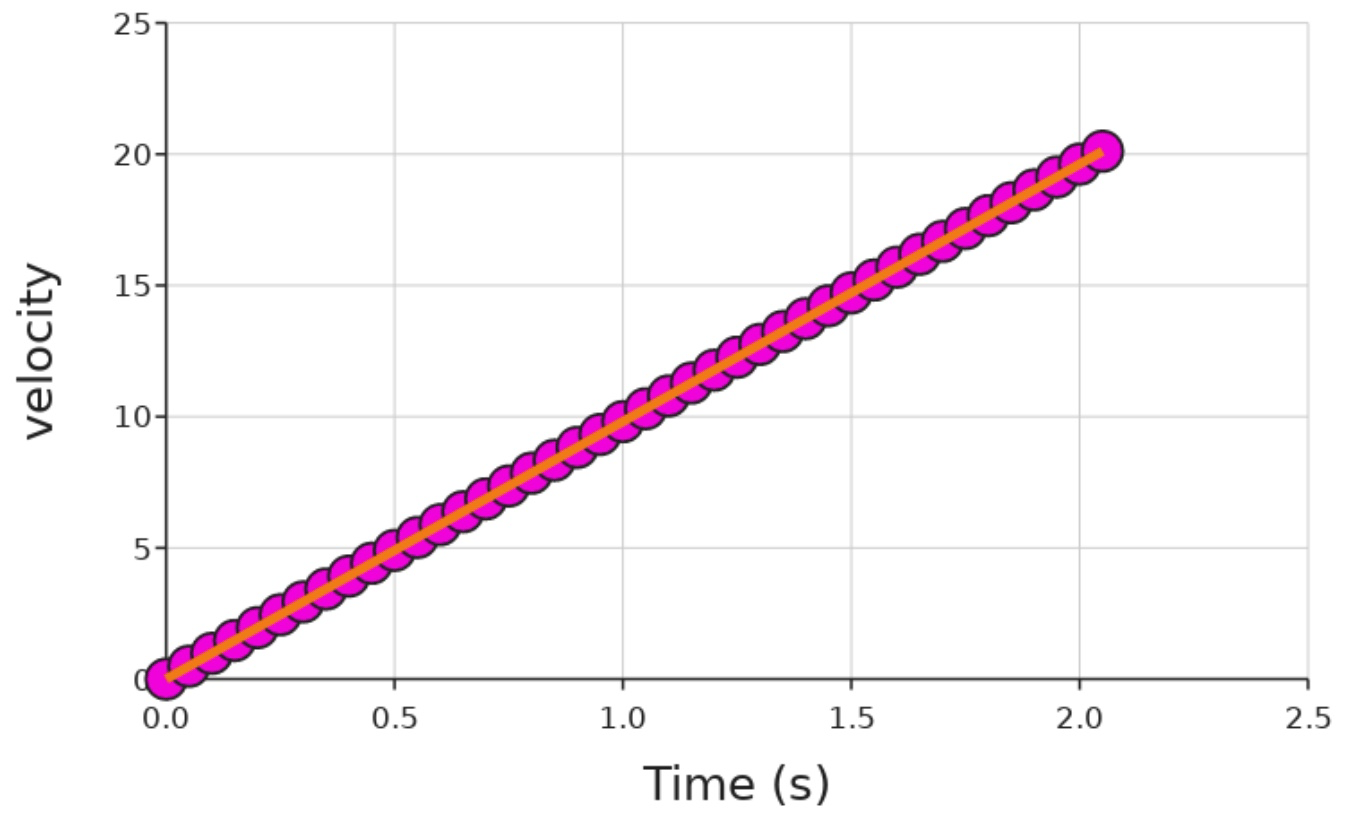
Which type of energy is calculated using velocity?
8) Compare the shape of the velocity vs time graph to the shape of the KE graph in #3. Why are they different, if they depend on each other? Use your understanding of energy equations as evidence for your answer.
9) In this scenario, we assumed no air resistance. What if instead, we measured everything perfectly and there was air resistance? How would this graph change? Would anything stay the same?
10) What do the values of PE, KE, and TE become when the diver hits the water and stops moving? If we know that energy is not created nor destroyed, where does that energy “go”?