Examining Ice (and geothermal heating)
Use this phenomenon based dataset to explore:
How does temperature vary inside an ice sheet?

Background
Scientists are gathering data in all kinds of extreme places - from the depths of mines, to deep sea explorations. Another incredible and dare we say - cool - place scientists have set up camp is in Antarctica, near the South Pole. Lots of different experiments are going on there, from exploring how climate change is affecting the icecap to digging cores of ice and exploring neutrinos. Even with a topic as complex as big-bang particles, scientists still take “simpler” data (like temperature) in the ice.
Why would it be valuable to drill into an ice sheet? The IceCube-Gen2 project reports that when it comes to Earth Science, “...occasions to drill the ice sheet almost to its bottom, which rests on the Antarctic bedrock, are rare and provide unique insights not only into the properties of the ice but also into what the configuration of this ice and the impurities it contains can tell us about the Earth’s past history.” (icecube-gen2.wisc.edu)

Temperature of ice data can actually tell scientists quite a few things - like density of the ice (which leads to predictions of glacial speed), or the intensity of geothermal heating. Geothermal heating is heating from the rocks in the earth - either due to volcanoes and hot springs, residual heat from Earths core from Earth’s formation, or radioactive rocks!
But how does heat even move through an ice sheet? The data may tell us!
Dataset
This data was gathered from the IceCube Neutrino Observatory and released in May, 2020. You can find the original data here.

DC wants to share that this image is not quite accurate for how ice cores are gathered. Check out https://icecores.org/about-ice-cores for a more accurate representation.
Variables
Temperature (C) - This info variable lists the date of the recorded earthquake.
Depth (m) - this numerical variable measures the depth of the thermistors (or thermometers) taking the data in the ice. 0m is the ice surface where it meets the air. Measured in meters.
Source - this categorical variable describes which research team (AMANDA, or IceCube) recorded the data. The values include AMANDA, 2007 IceCube, 2009 IceCube, and 2010 IceCube
Activity
Part 1 - Predictions
Before we look at ice, let’s try and make some predictions based on how oceans change with depth. Take a look at these two graphs. Both show how temperature and depth are related but in different locations on the globe:

What is the general trend of data when it comes to oceans? (“As depth increases…”)
2) What effect does the surface (air temperature, sun intensity) have on ocean temp have at the shallower depths? Provide evidence for your answer from the two graphs.
3) What do you predict to see when it comes to data about the south pole ice sheet? How might the data trend?
Part 2 - Ice Sheet Data
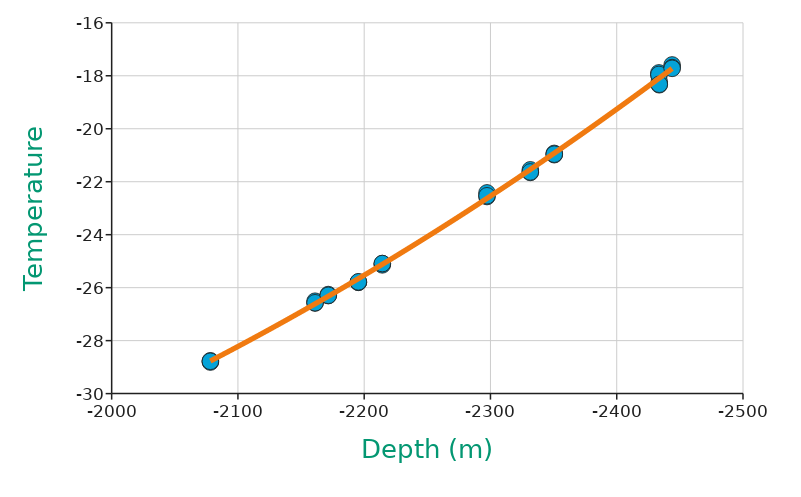
4) Time to explore the data gained from the Antarctic Ice Cube experiment. Use the Make a Graph tool to create a dot graph for Temperature vs. Depth graph by showing Temperature as X variable, and Depth as Y variable. Note: this is the opposite axis as our prediction graphs. Screenshot your graph below:

5) Write a sentence stating what this data is telling us:
6) Time to add a regression line to see if there is a clear pattern. Screenshot your new graph below:

Include your regression line equation here:
7) How does temperature vs depth for an ice sheet compare to similar depths of the ocean? Why might there be differences?
Part 3 - Impact of Collaboration
8) This data is combined from two different research projects: AMANDA, and Ice Cube (2007, 2009, 2010). Exclude AMANDA data, leaving the regression line. Screenshot your graph below:
Include the equation for this graph:
9) Now do the opposite and exclude the IceCube data (2007, 2009, and 2010). Screenshot your graph below:

10) Compare the equations from #8 and #9, to your combined data equation in # 6. What value is there in scientists from different projects working together?
*Teachers can request an answer key through the form below.