Mapping Volcanoes
Investigating data of great magma-tude.
Background
Vesuvius. Mount Pelée. Tambora. St. Helens. Volcanoes make major news in both modern times and history books. The spectacle of lava, smoke, poisonous gas and earthquakes cannot be ignored. The national park service reports that most of our knowledge of prehistoric volcanoes come from oral histories and geological evidence. In current times, technologies allow us to not only see what’s happening on land, but in the depths of the ocean as well. This infiltration of energy into our world is a not-so-subtle reminder that the earth continues to shift mysteriously beneath our feet.
In 2022, when Hunga Tonga–Hunga Haʻapai began erupting in the South Pacific, volcanologists around the world raced to investigate and record all they could about the event. Even though we have a fair amount of knowledge about volcanoes, their infrequency leaves so much more to be understood. How can looking at data from past volcanoes help us understand them better? Can this understanding lead to predictions about upcoming volcanic activity in order to keep people safe?
Explore the dataset to find out!
Dataset
This data set was sourced from kaggle.com with data coming from the Smithsonian Institution Global Volcanism Program. You can read more about it on their website here. Note: For simplification purposes, the original dataset variables have been reduced to the most relevant measurables.
Variables
Year - This numeric variable tells which year the volcano erupted. Negative numbers are “BCE” (Before current era) and positive numbers are “CE” (current era).
Name - This info variable lists the name of the volcano.
Location - This info variable indicates the country where the volcano resides.
Longitude - This numeric variable indicates the longitude measurement for that volcano’s location. Measured in degrees.
Latitude - This numeric variable indicates the latitude measurement for that volcano’s location. Measured in degrees.
VEI - This numeric variable is a measurement of the intensity of the volcano. Volcano Explosive Index (VEI) factors in things such as how much matter erupts, the height of the eruption cloud, and other qualitative observations. The range goes from from 0 (non-eruptive) to 8 (mega-colossal eruption).
Activity
Part 1 - what can we know?
When it comes to volcanoes, there are quite a few interesting questions we could wonder about:
How soon will the next volcano erupt?
Where will the next volcano erupt?
Are there specific locations where volcanic activity is higher than others?
Where are the most intense volcanoes located?
Is a certain type of volcano more dangerous than others?
What part of the world suffers the most damage due to volcanoes?
Some of these questions can be answered by our dataset, and some cannot. By looking at the variables we have available, determine which 3 questions can not be answered. Grey out any questions we will not be able to investigate today.
2. Why can’t we answer these questions? (What variables are missing?)
Part 2 - Make the graphs
Time to investigate some of the more interesting questions:
Question A: Are there specific locations where volcanic activity is higher than others?
3. Use the Make a Graph tool to create a histogram. Set Longitude as the x-variable. Number should display as the y- variable. Screenshot your graph below:

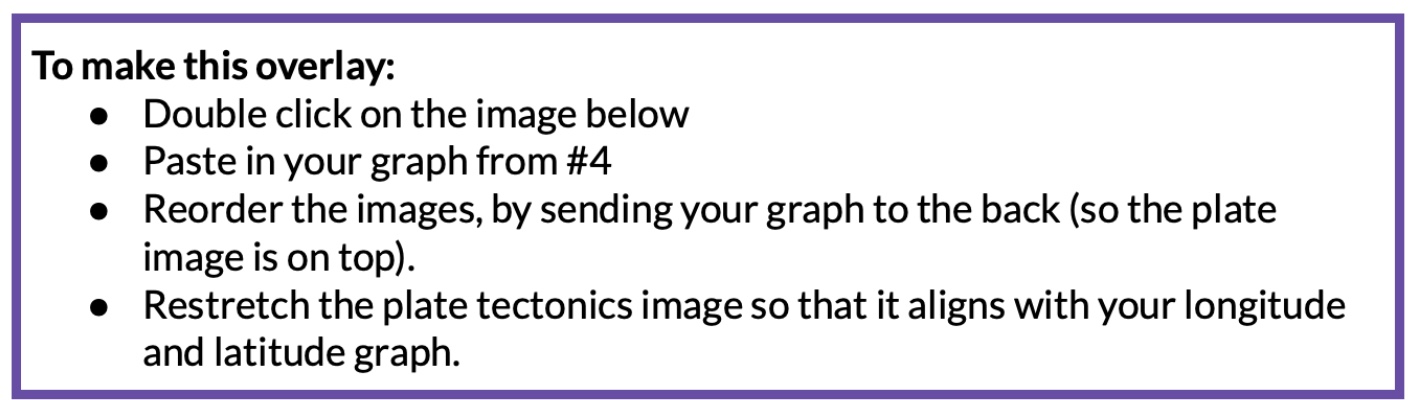
4. Based on the histogram information, double click the image below and move the circle to the area of the world with the highest concentration of volcanoes.
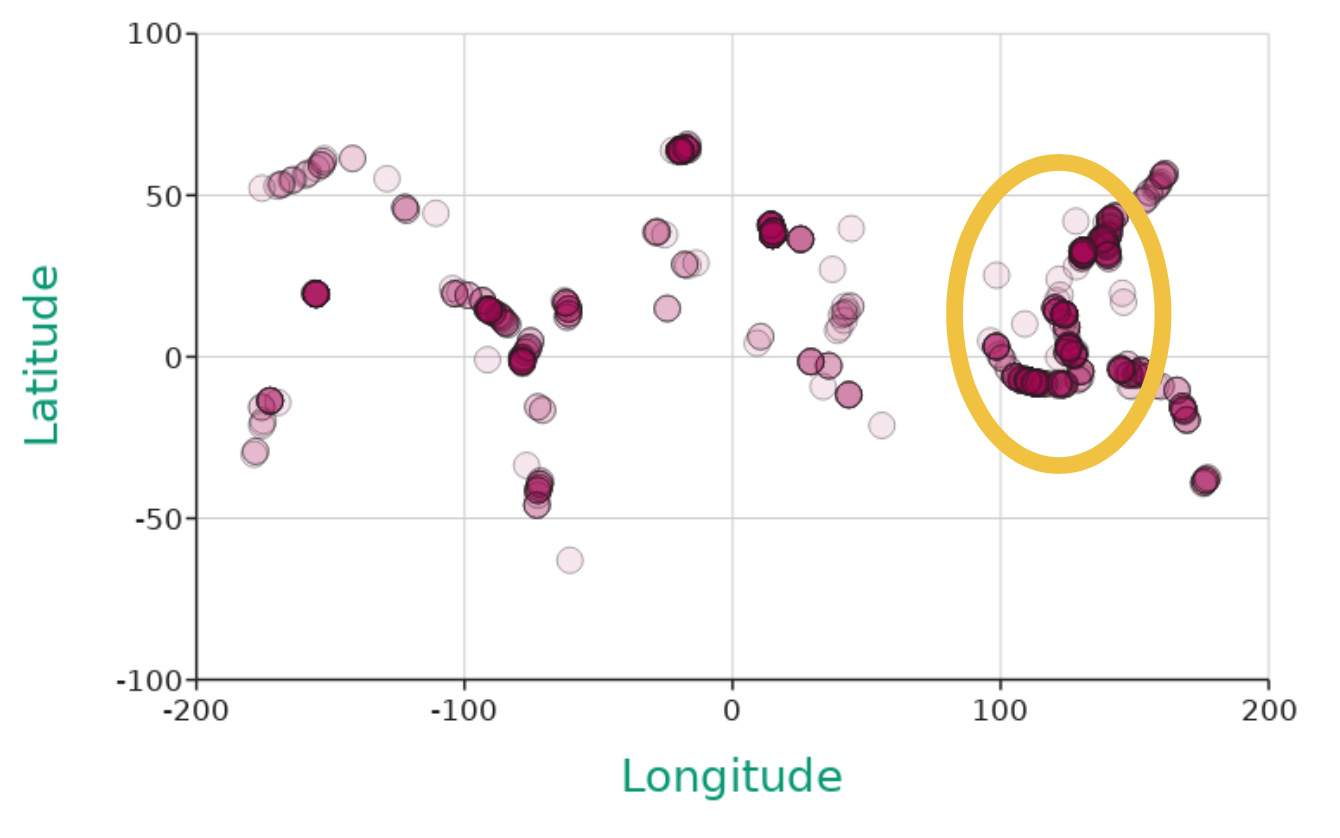
5. What conclusion can you draw from the data, as an answer to the original question?
Question B: Where are the most intense volcanoes located?
6. Use the Make a Graph tool to create a dot graph. First, set Longitude as the x-variable and Latitude as the y- variable. Set VEI as the z- variable. Screenshot your graph below:
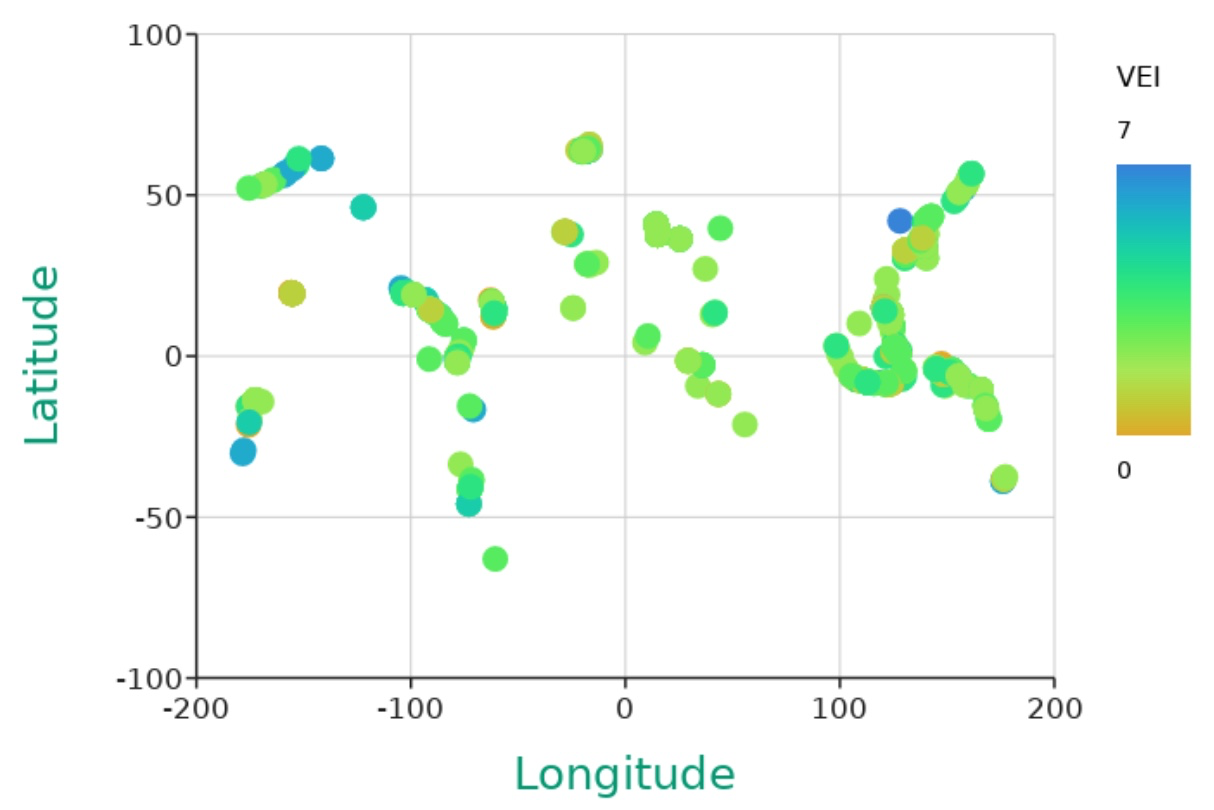
7. What conclusion can you draw from the data, as an answer to the original question?
8. In order to make this graph even more powerful, we are going to overlay plate boundaries onto your longitude and latitude volcano graph from #7.

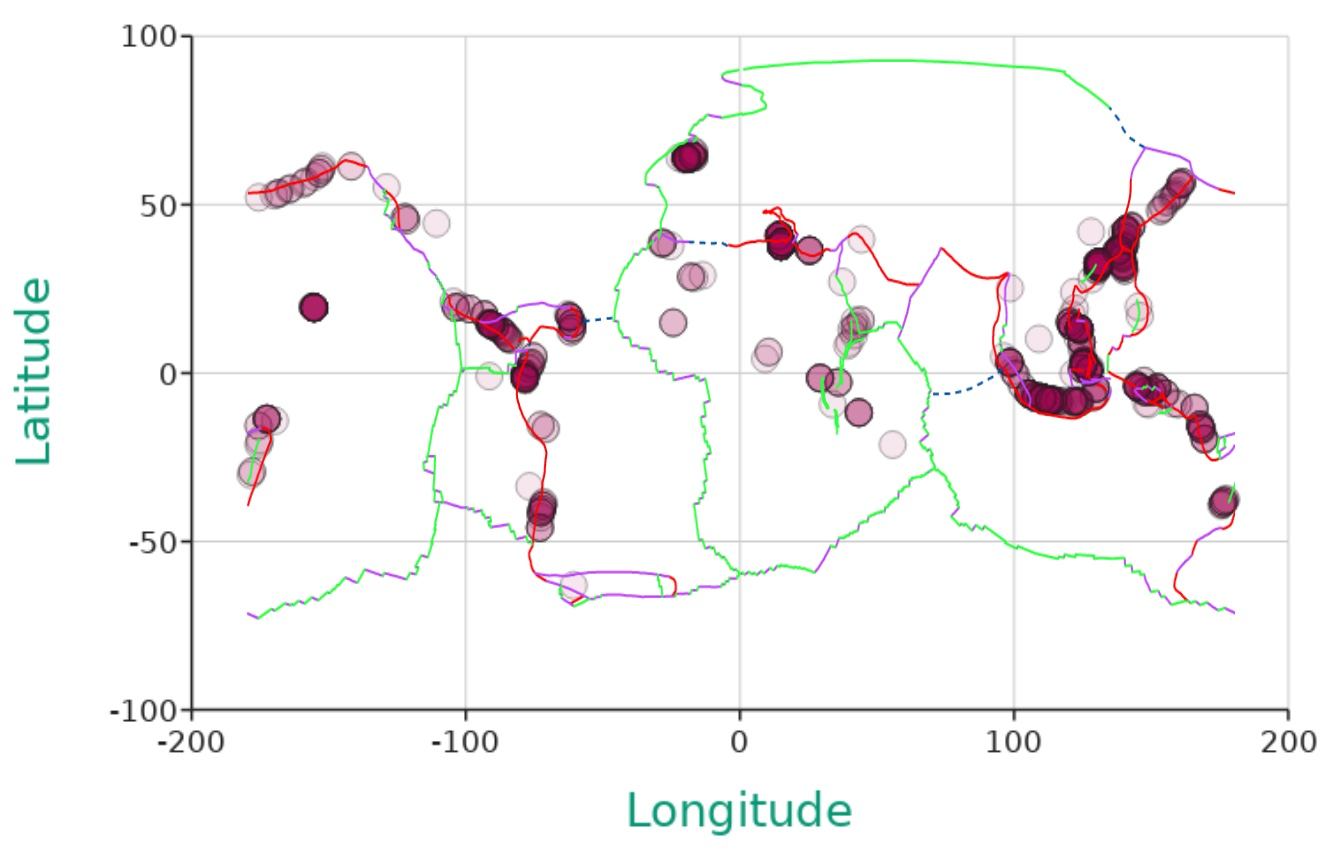

9. Using the legend provided on the right, what can we determine about where volcanoes emerge?
10. Based on your answer from #9, what places in the world are you surprised to see DO NOT have any historically recorded volcanic eruptions?
11. What does this topographical map say about that region you were discussing in #10? (What topographical features reside there). You can use the following map, and map overlayed with the plate boundaries to help you.
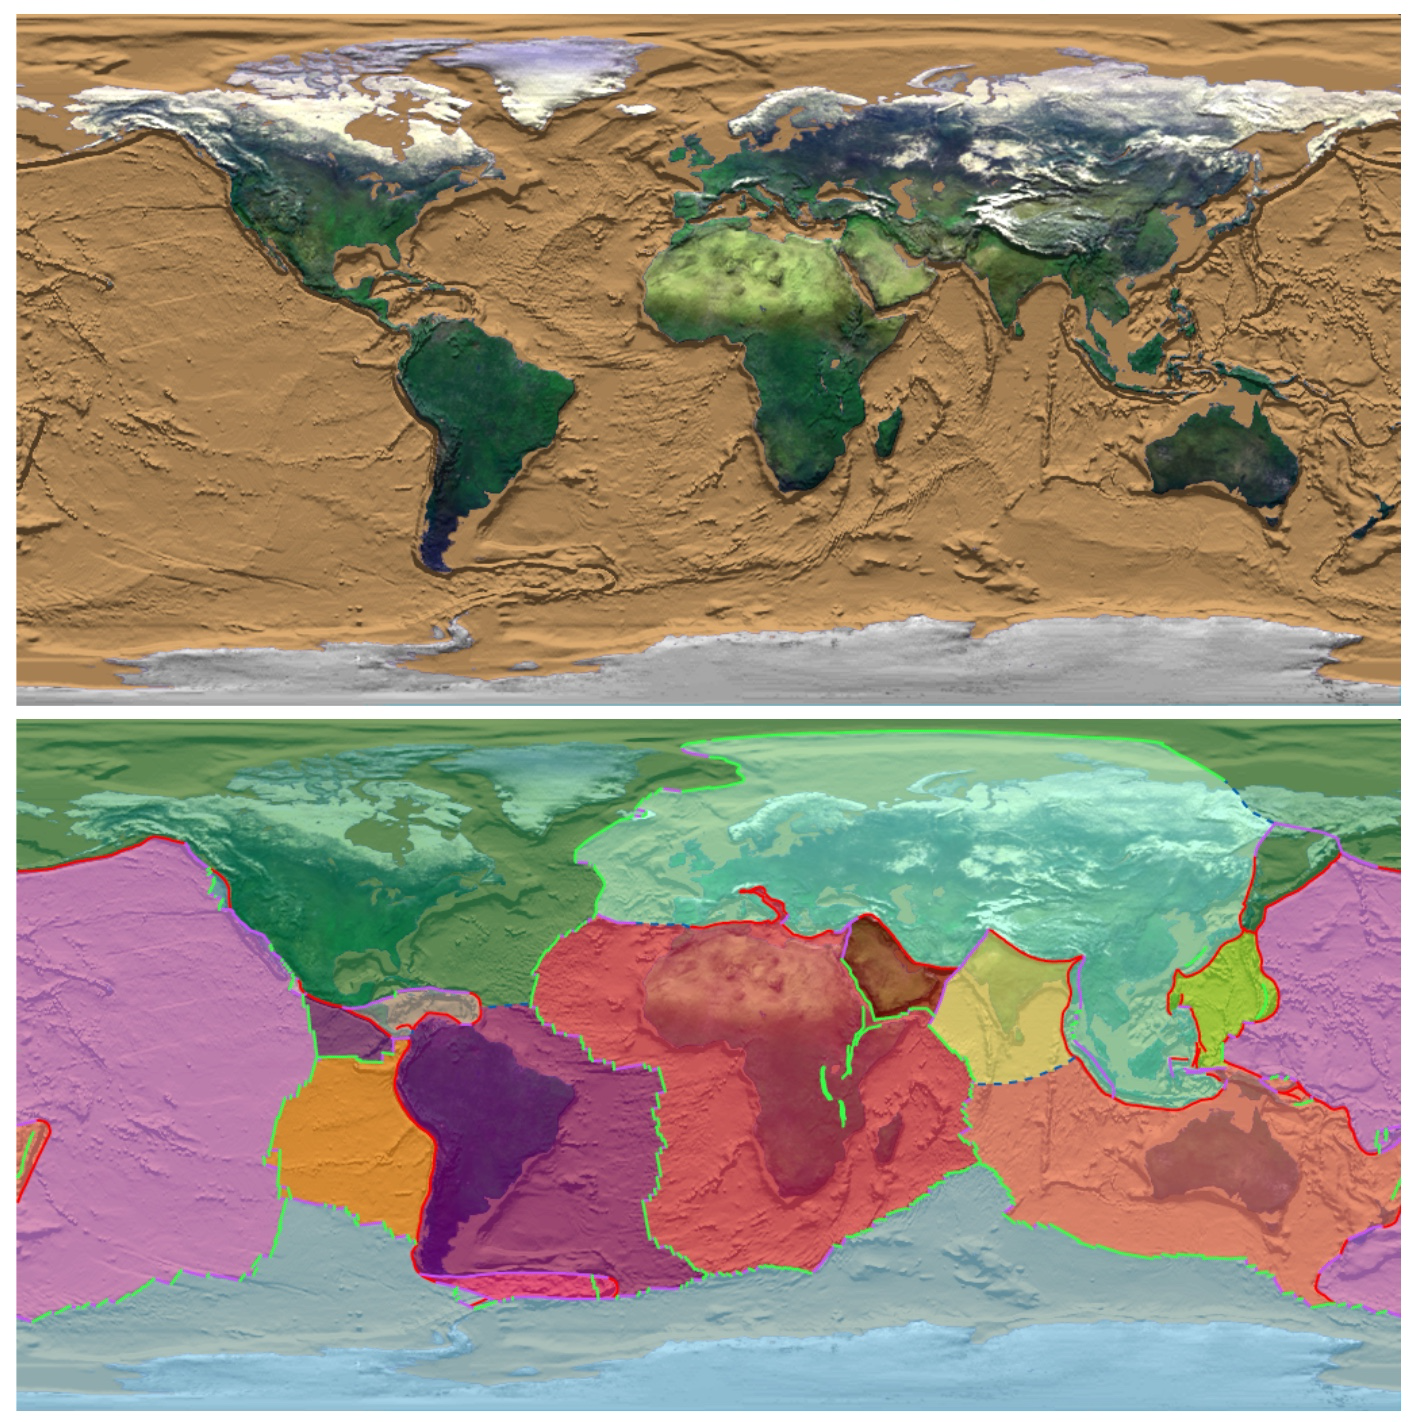
12. While the data we have stretches back to 4000 BCE, in terms of the age of the Earth (estimated at 4.5 billion years) it is fairly recent data. What kinds of landforms are “newly” formed, located along the plate boundaries with high volcanic eruption records?
*Teachers can request an answer key through the form below.