The Plastics Problem
What is the world doing with waste?

Background
Plastic is one of the most incredible inventions. It does everything from holding our mayo to allowing cars to be made more comfortably and inexpensively. While it is an organic substance, it is not an organic combination that naturally occurs in nature, and decomposing creatures can’t take care of breaking it down quickly and easily (check out more info about it here). With nothing to break them down, plastics can remain for hundreds of years or longer after they have been disposed of. In fact, we don’t yet fully know how long all types of plastics take to break down in nature! This means that the plastics that humans create today are likely to take up space and remain present in our environment for years to come.

Are humans doing a good job handling plastic and waste well? One argument is that plastic can be recycled, so its prevalence in our world is not much of an issue. Another is that we can incinerate (burn) some waste, breaking it down more quickly than worms or bacteria could (and also taking care of some materials which are not organic - like metals or plastics). If these options don’t work, landfills will be needed to hold the extra waste.
What does the data say about how we are actually dealing with our waste? And which region of the world has figured out how to manage waste most effectively?
Dataset
This dataset was sourced from ourworldindata.org. You can find the original dataset here.
Variables
Entity - This categorical variable describes the region of the world. Values include Americas (excluding the United States), Asia (excluding china), China, Europe, India, Middle East, Oceania, Sub-saharian africa, United States, and World total.
Year - This numeric variable describes the year the data were recorded.
Recycled (%) - This numeric variable describes the share of waste recycled from total regional waste. Measured in percent.
Incinerated (%) - This numeric variable describes the share of waste incinerated from total regional waste. Measured in percent.
Mismanaged (%) - This numeric variable describes the share of waste mismanaged from total regional waste. Measured in percent.
Landfilled (%) - This numeric variable describes the share of waste landfilled from total regional waste. Measured in percent.
Activity
Make a graph of year on the x-axis and Recycled on the y-axis. Select entity as the z- variable. Screenshot your graph below:

2) Add regression line to your graph and group by z. Screenshot your graph below:
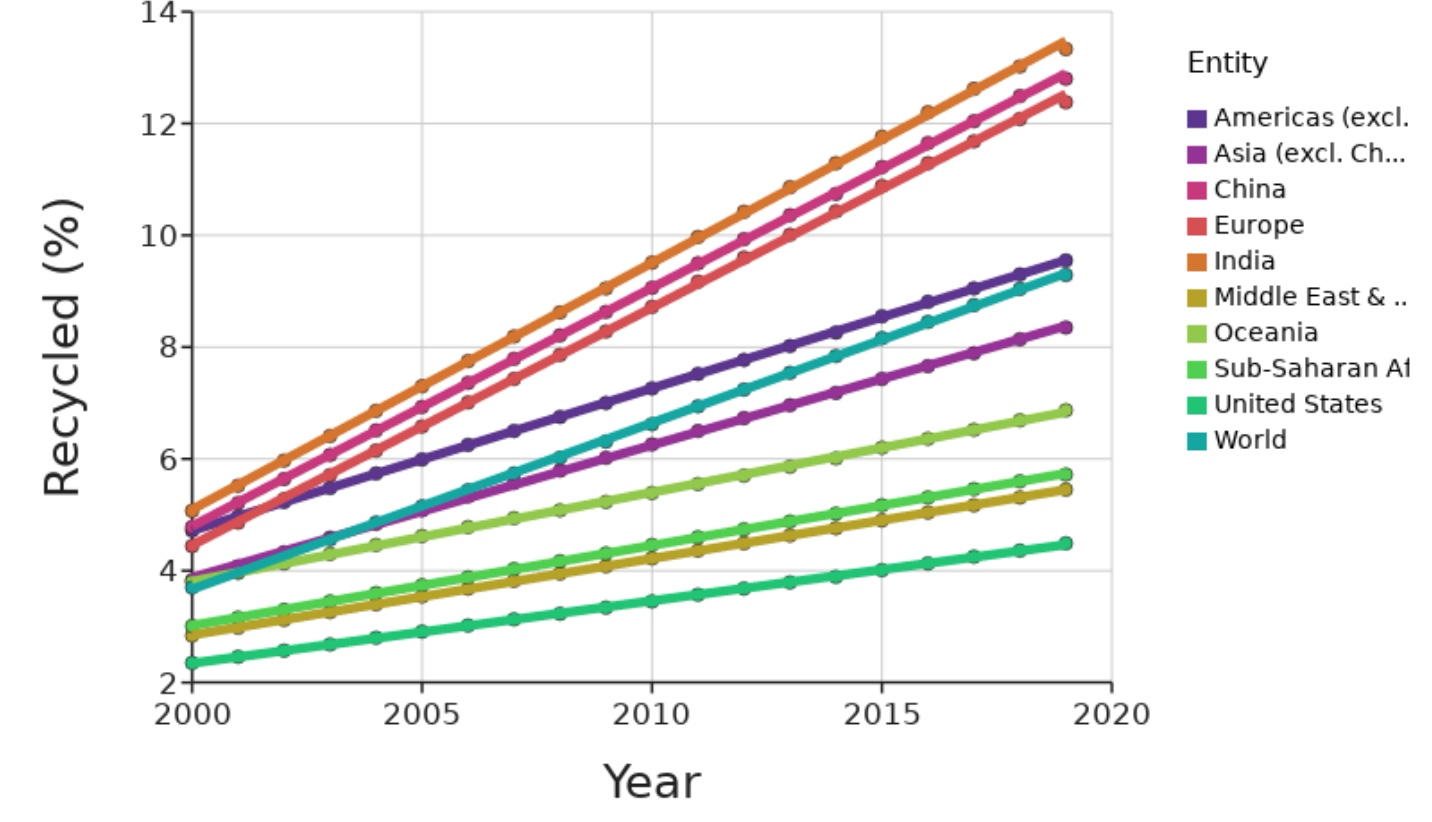
3) Based on the graph you created in #2, which 2-3 countries have the highest percentage of their waste being recycled? Which 2-3 countries have the least? (Hint: If the colors are confusing, float your pointer over a datapoint and you can see the Entity value)
4) Which country is doing the most work to improve the amount of recycled waste? What evidence do you have for this, from the graph?
Extension: Add a regression line and group by z. What evidence does the regression line provide to back up your answer about who is doing the most work to improve recycled waste?
5) Make a graph of year on the x-axis and Landfilled on the y-axis. Keep entity as the z-axis variable. Screenshot your graph below:

6) Which country has made the most improvements in decreasing their landfill percentage? What evidence do you have for this from the graph?
Extension: Add a regression line and group by z. What evidence does the regression line provide to back up your answer about who is doing the most work to improve recycled waste?

7) Have any countries increased in the percentage of waste going into landfills? If yes, which?
8) Let’s examine how the United States is doing compared to world averages. Exclude all Entities except for the United States and World. Landfilled should still be on your y-axis (with time on x-axis and entity as z-variable). Screenshot this graph as well as the other three types of trash disposal and include them below:
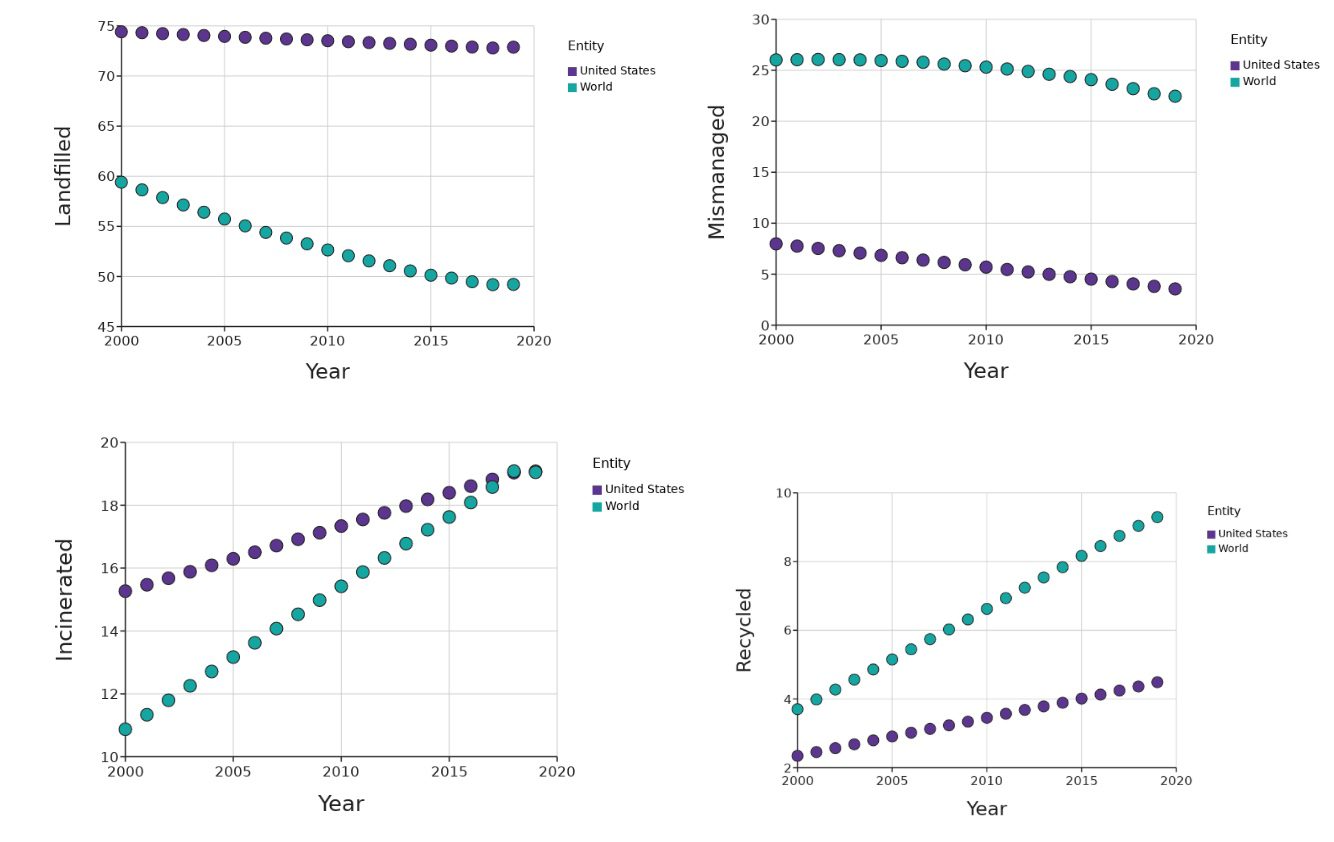
9)How do you feel the US is doing when it comes to taking care of plastics and waste? Use these graphs as evidence for your opinion.
10) OPTIONAL: Pick one more entity to compare to world averages. Repeat what you did for #6 (including images below), and evaluate how well they are doing when it comes to dealing with waste (similar to #7).